
Figure 6. LysoTracker Red (LT) staining following VPS35 silencing.
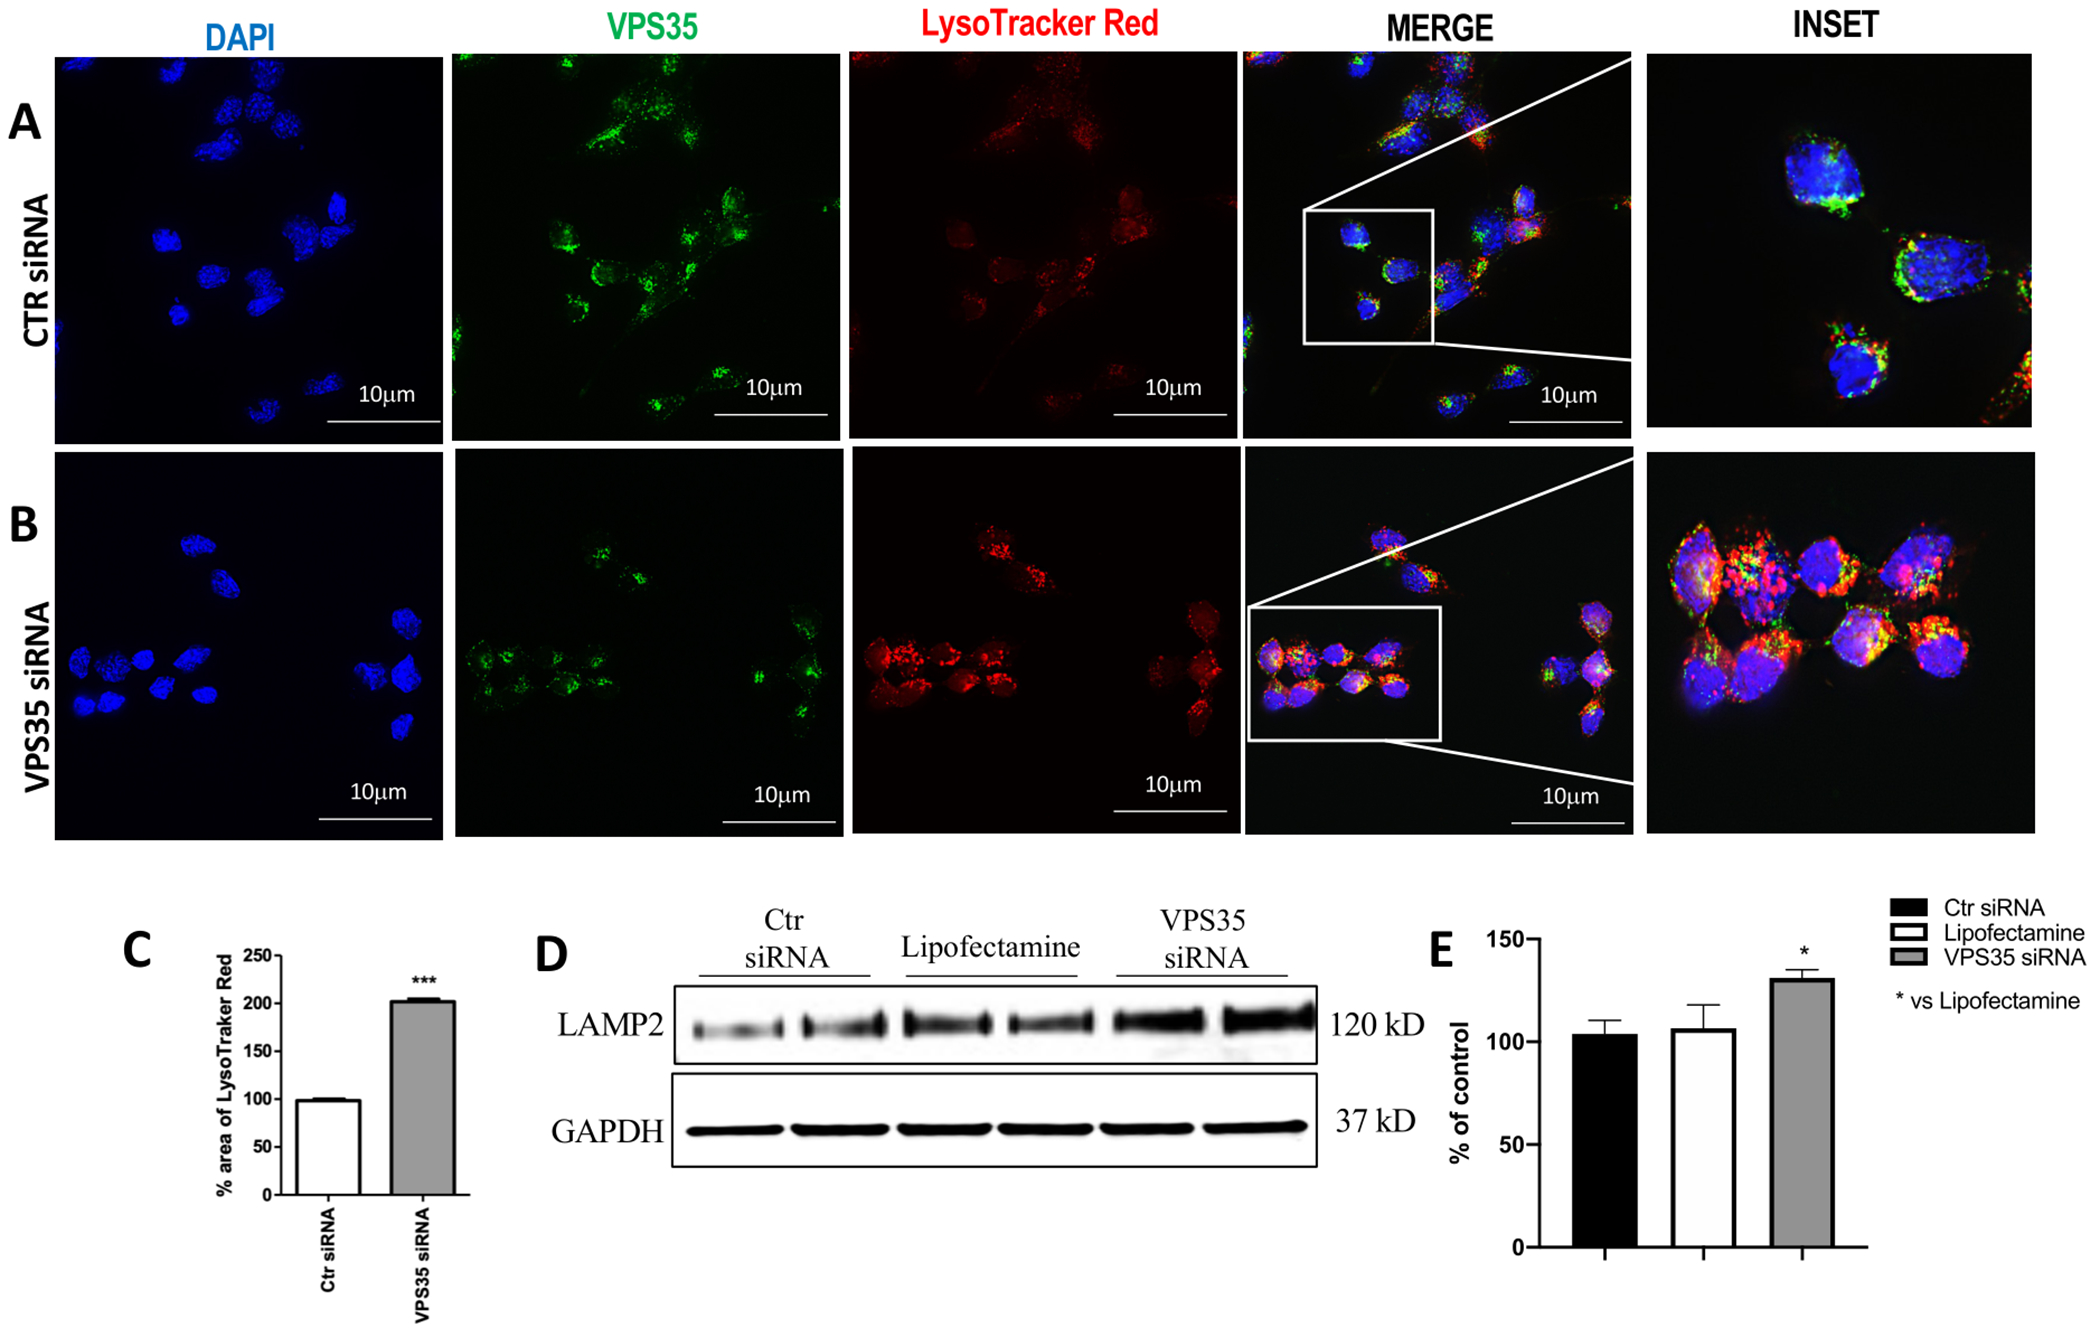
Control cells (A) or VPS35 siRNA-treated cells (B) labeled for VPS35 (FITC channel, green) antibody and LT live cells dye (TXred channel, red). The distribution of acidic vesicles was visualized using fluorescence microscopy (100× magnification) (Scale bar: 10 μm). Percentage area of LT (C) (*** p < 0.001 vs Ctr siRNA). Representative Western blot for LAMP-2 protein in N2A-APPswe cells transfected with VPS35 siRNA or controls (Lipofectamine, scramble siRNA) (D). Densitometric analysis of the immunoreactivity to LAMP-2 antibody (* p< 0.05 vs Lipofectamine) (E). All results are mean ± SEM (N=2 per groups, three individual experiments). Data are from three individual experiments.