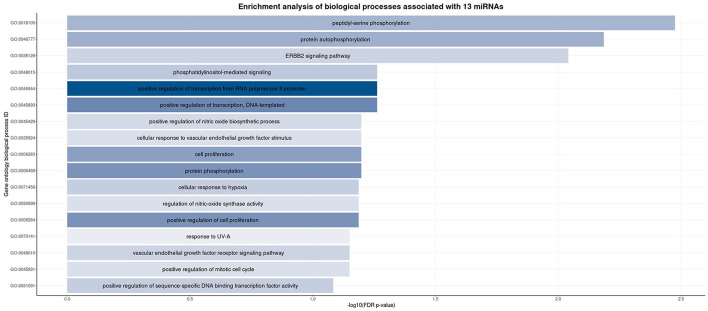
Figure 3.
Enrichment analysis of the biological processes associated with our miRNA gene target list at three different timepoints post-injury. We used the DAVID database to upload a list of target genes based on the miRNAs found to be significantly associated with PPCS in our cohort. This figure presents the biological processes found to be significantly associated (false discovery rate p-value < 0.10). Each bar represents a biological process ID, whose gene ontology ID and corresponding description are listed. The width of each bar represents the –log10(FDR p-value) while the color of each bar indicates the count (number) of our target genes associated with that particular biological process.

