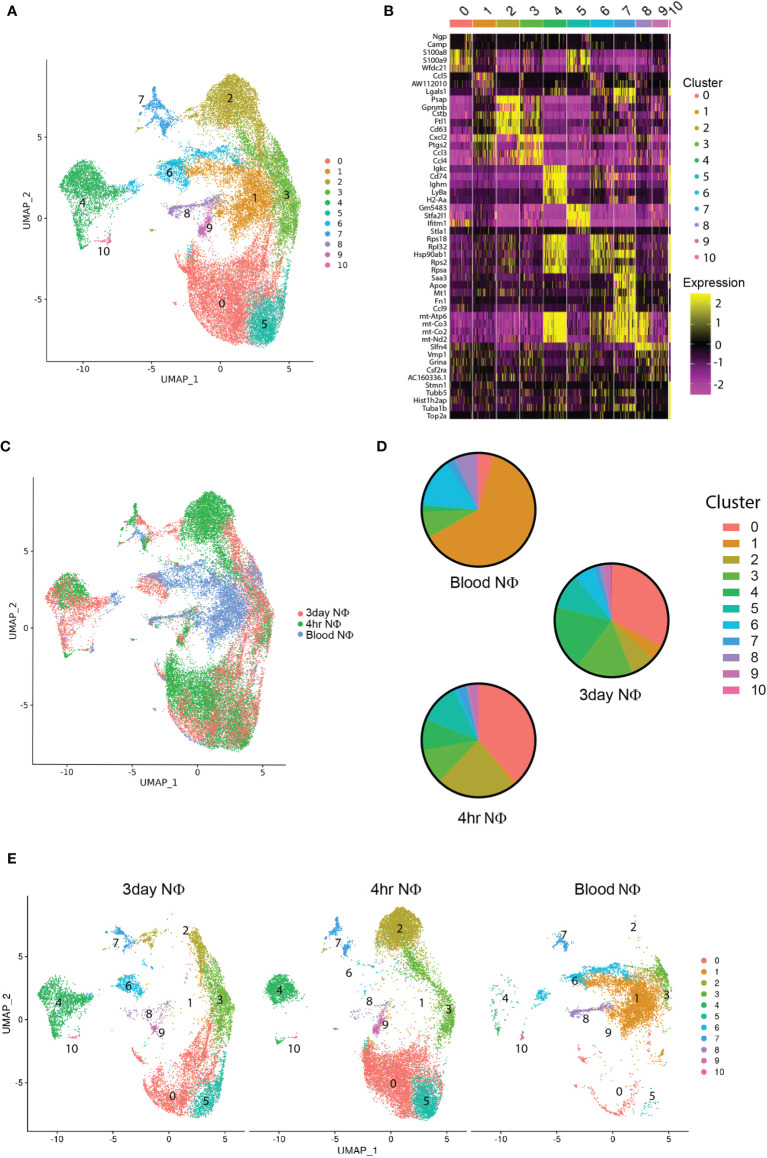
Figure 2.
scRNA seq characterization of neutrophils. (A) scRNA seq of purified blood, 4 hour, and 3 day neutrophils unbiased cluster formation based on differentially expressed genes in each cluster. (B) Heat map of the top 5 cluster defining genes for each cluster. (C) Overlay of neutrophil type on the defined UMAP clusters from (A) showing the location of blood neutrophils, 4 hour, and 3 day i.p zymosan stimulated neutrophils. (D) Pie charts illustrating the percentage of total neutrophils in each cluster for blood, 4 hour, and 3 day neutrophils. (E) UMAP clustering analysis demonstrating the cluster distribution of all cells from each neutrophil group (blood, 4 hour, and 3 day) within the total cellular analysis of all cell groups combined.

