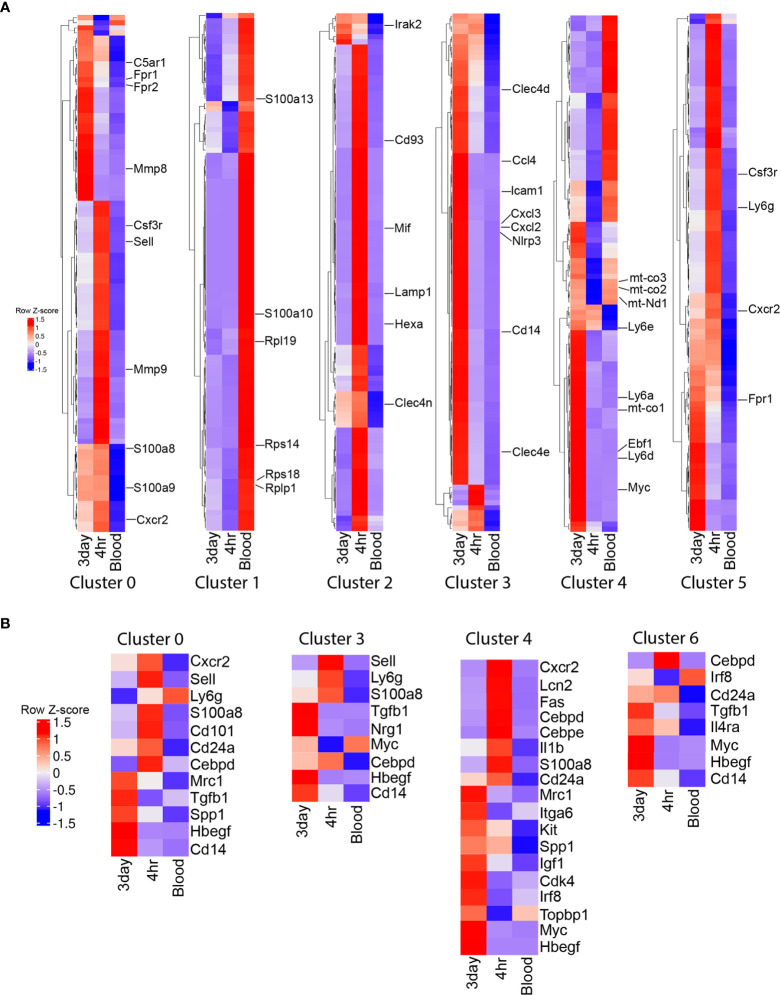
Figure 3.
Single cell RNA sequencing cluster evaluation. (A) Heat map of the top 100 differentially expressed genes that define the clusters with the highest percentage of cells (0, 1, 2, 3, 4, and 5) with select genes displayed. (B) Heat map showing relative gene expression of genes associated with maturation and activation state across neutrophil populations within the clusters with the highest percentage of 3 day neutrophils.

