Figure 4.

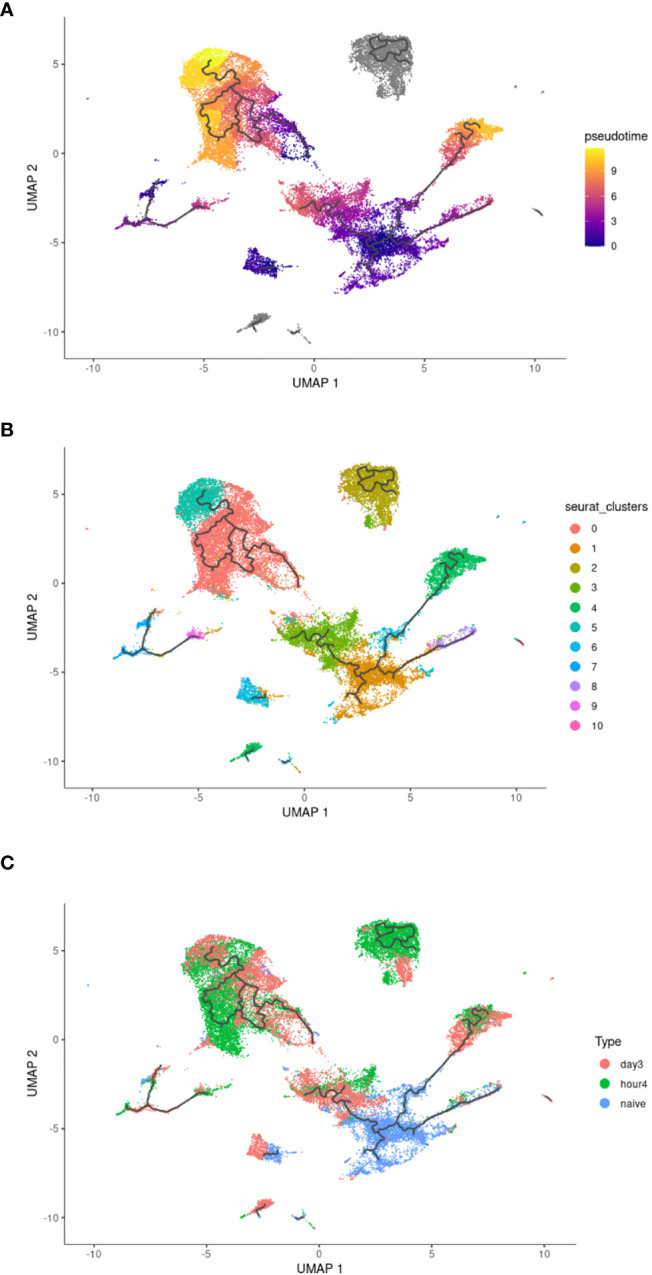
Pseudotime analysis of neutrophil clusters. (A) Pseudotime analysis. (B) Pseudotime UMAP with overlay of original clusters as defined in Figure 2A. (C) Distribution of each neutrophil population within the pseudotime UMAP.

Pseudotime analysis of neutrophil clusters. (A) Pseudotime analysis. (B) Pseudotime UMAP with overlay of original clusters as defined in Figure 2A. (C) Distribution of each neutrophil population within the pseudotime UMAP.