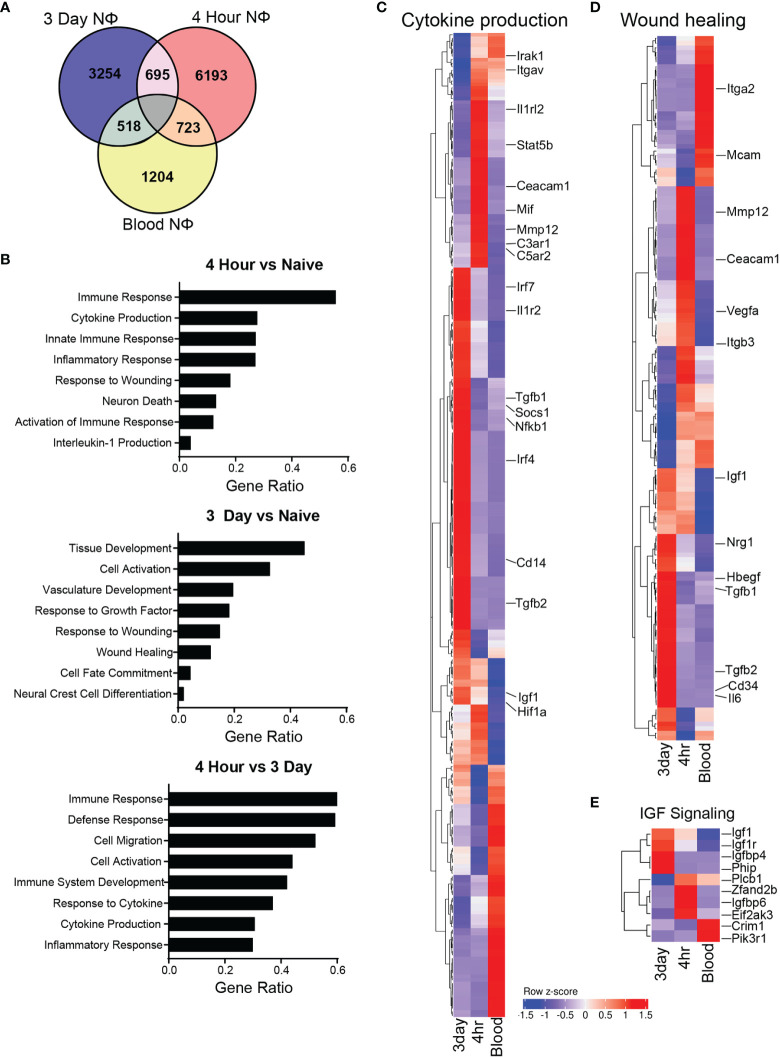
Figure 5.
Neutrophil gene expression is unique and diverse. (A) Venn diagram of unique and overlapping genes between the 3 different neutrophil types. (B) Selected GO biological process pathway comparison based on differential expression of genes uniquely upregulated in each cell type. (C) Heat map of gene expression with select genes displayed from the cytokine production GO biological process pathway. (D) Heat map of gene expression with select genes displayed from the wound healing GO biological process pathway. (E) Heat map of gene expression from the insulin like growth factor GO signaling pathway between neutrophil subsets.

