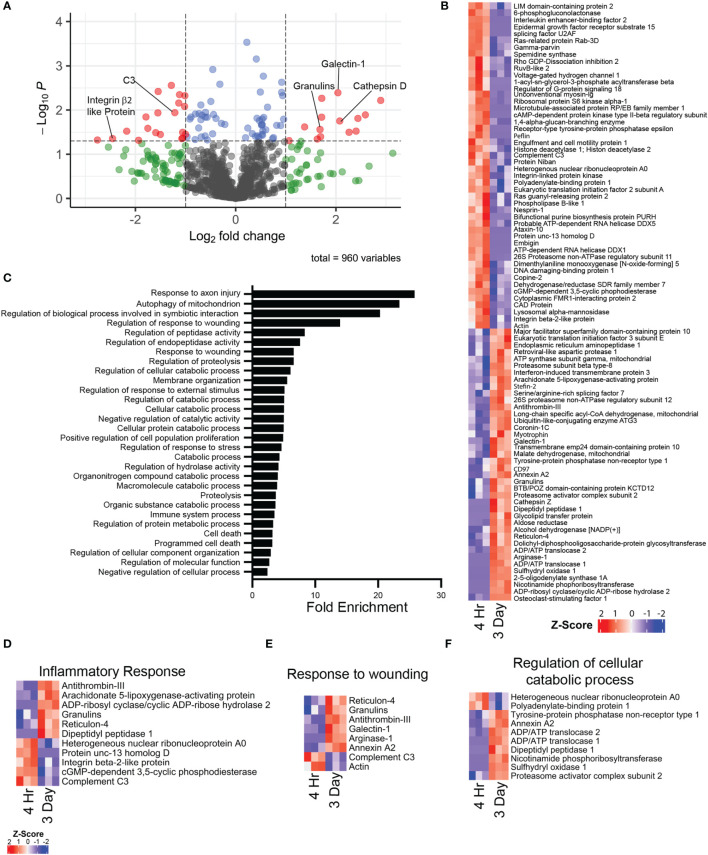
Figure 6.
Mass spectrometry proteomic comparison of i.p. zymosan stimulated 4 hour and 3 day neutrophils (n = 3 mice per group). (A) Volcano plot illustrating differential protein expression between 4 hour and 3 day i.p. zymosan stimulation neutrophils. (B) Heat map of differentially expressed proteins between 4 hour and 3 day neutrophils as represented by row z-score. (C) Top differentially expressed GO biological process pathways based on proteins with increased expression in the 3 day neutrophils compared to 4 hour neutrophils. (D–F) Heat maps of selected GO biological process pathways, illustrating expression of proteins between 4 hour and 3 day neutrophils in the (D) inflammatory response pathway, (E) response to wounding pathway, and the (F) regulation of cellular catabolic process pathway.

