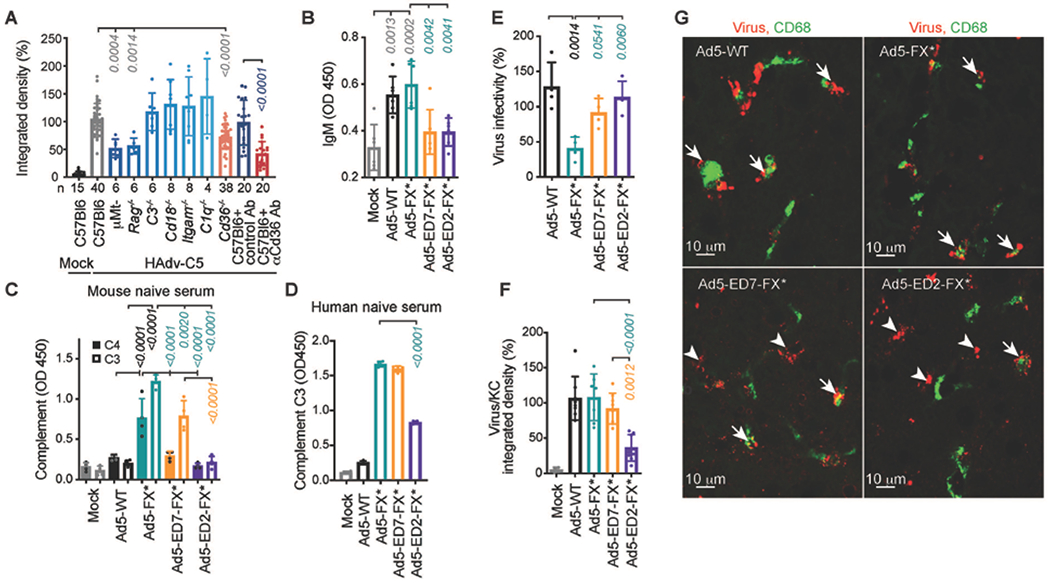
Fig. 1. Natural IgM bind HAdv-C5 through hexon HVR1 loop.

(A) Integrated density of HAdv-C5-positive staining within CD68- and F4/80-positive cells on liver sections from indicated gene-deficient mice or wild-type mice pre-treated with isotype control or anti-CD36 Ab, 30 minutes after intravenous HAdv-C5 administration. Number of replicates (n) are indicated under each bar. (B) ELISA measurement of natural IgM binding to indicated viruses in mouse plasma (n = 6). (C) Detection of complement components C4 and C3 deposition on the surface of the virions for indicated viruses in mouse serum (n = 4). (D) Detection of complement C3 deposition on the surface of the virions for indicated viruses in human naive serum, lacking HAdv-C5-specific neutralizing antibodies (n = 4). (E) Virus infectivity after incubation with 90% of the raw mouse serum normalized to virus infectivity with no serum treatment determined on HEK293 cells (n = 4). (F) Graphical representation and (G) representative images of immunofluorescent staining of sections of livers harvested from WT mice 30 minutes after intravenous injection with indicated viruses. Kupffer cell CD68-specific staining is in green. Staining with adenovirus-specific polyclonal antibodies is in red. Arrows point to virus staining co-localized with Kupffer cells and arrowheads show virus staining that does not co-localize with Kupffer cells (n = 4-8). The p-values of one-way ANOVA with multiple comparison adjustments are shown above the bars. Bars show mean ± SD. The color of the p-value number indicates the partner for multiple comparison tests. The methodology and statistical details are as described in Table S1 and Methods.
