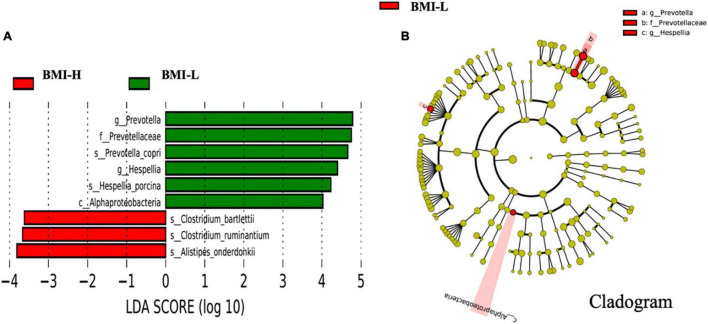
FIGURE 3.
Differently abundant taxa identified using LEfSe analysis. (A) Visualization of only taxa meeting an LDA threshold >2. (B) LEfSe Cladogram showed the most differentially abundant taxa between the two groups. Taxa enriched for body mass index above 25 kg/m2 in red and below 25 kg/m2 in green. The brightness of each dot was proportional to its effect size.

