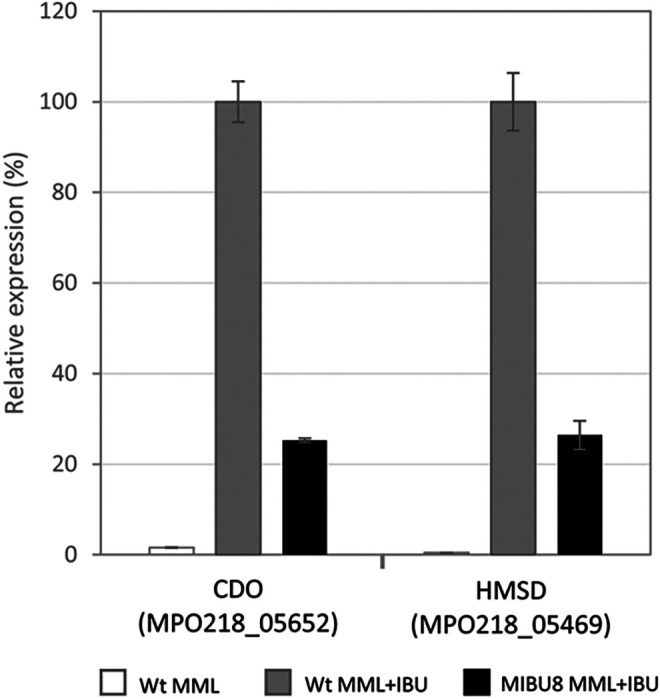
FIG 6.

Relative expression of genes encoding CDO and HMSD. qRT-PCR analysis of the expression of genes encoding CDO (locus MPO218_05652) and HMSD (locus MPO218_05469) in the wild-type (WT) MPO218 versus the insertion mutant MIBU8 in MML in the absence and presence of IBU. The gray bars represent the expression level in MPO218 WT growing in MML plus IBU (correspond to the maximum expression level, 100%). White bar represents the percentage expression of MPO218 WT in MML compared to MML plus IBU, and the black bars correspond to the percentage of expression in the MIBU8 mutant compared to the WT strain in MML plus IBU. The graph represents the mean ± SD of 3 to 4 technical replicates.
