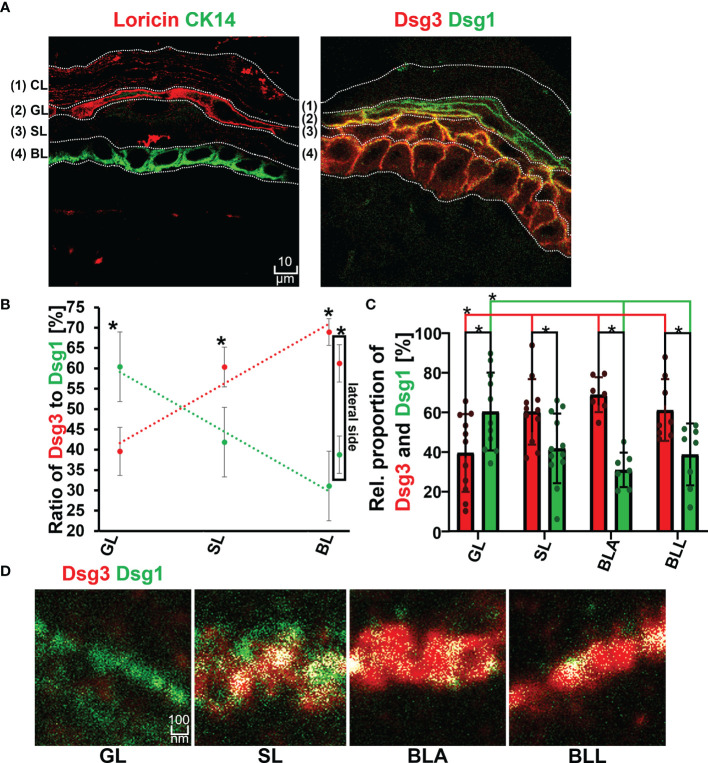
Figure 2.
(A) Confocal microscopy images showing the identification of layers by staining of Loricin (red) and Cytokeratin 14 (Ck14 green) on the left and distribution of Dsg1 (green) and Dsg3 (red) along the epidermal layers and right. (B) Relative proportion of Dsg1 and Dsg3 along the different epidermal layers. (C) quantification of relative stained area of Dsg1 and Dsg3 along the epidermal layers. (D) STED microscopy images of the double staining borderof Dsg3 (red) and Dsg1 (green) at a single cell border, along the different epidermal layers. N (body donors)=3, n (cell borders)=2-7. *Significant difference to the value which is indicated that it is compared to.

