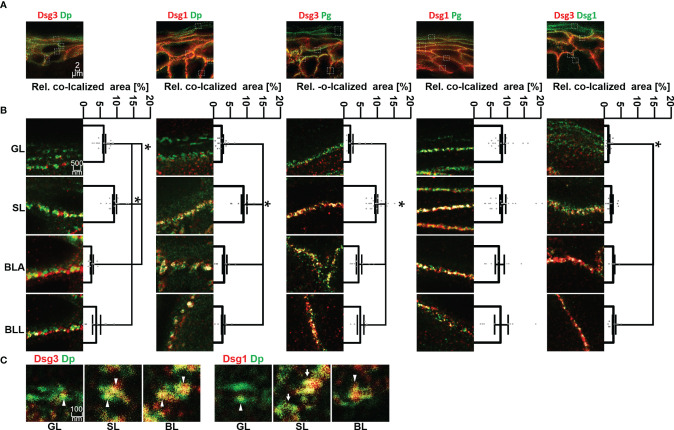
Figure 3.
(A) Confocal microscopy images of co-stainings of Dsg3 or Dsg1 (red) with Dp, Pg or Dsg1 (green). (B) STED microscopy images of zoom to single cell border of the different epidermal layers. Shown to the right are quantifications of the co-localization of the two stained proteins. (C) STED microscopy images of co-stainings of Dsg3 or Dsg1 (red) with Dp (green) in human skin samples, sowing a resolution on a single desmosome scale. White pointers domains containing only either Dsg1 or Dsg3, white arrows whole desmosomes, containing almost only Dsg1 or Dsg3. N (body donors)=5, n (cell borders)=2-6. *Significant difference to the value which is indicated that it is compared to.

