Figure 4.
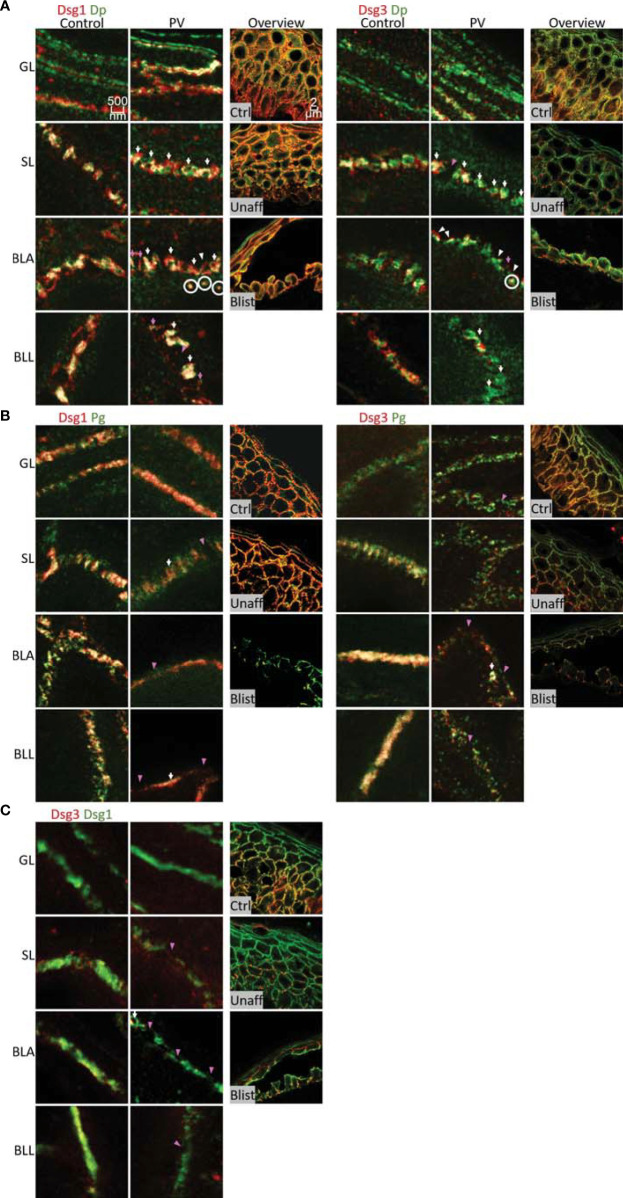
STED microscopy images of single cell borders from control vs. PV patient skin, and confocal image for overview of control, unaffected PV skin and blister region of PV skin. Co-stained for: (A) Dsg1 or Dsg3 (red) and Dp (green). (B) Dsg1 or Dsg3 (red) and Pg (green). (C) Dsg3 (red) and Dsg1 (Green). Fragmented and depleted Dsg3 staining pink arrows, clustered Dsgs white arrows, Fragmented desmosomespink pointers, split desmosomes white pinters, cytoplasmic Dsg-Dp-units white circles. N (body donors)=5, n (cell borders)=2-6.

