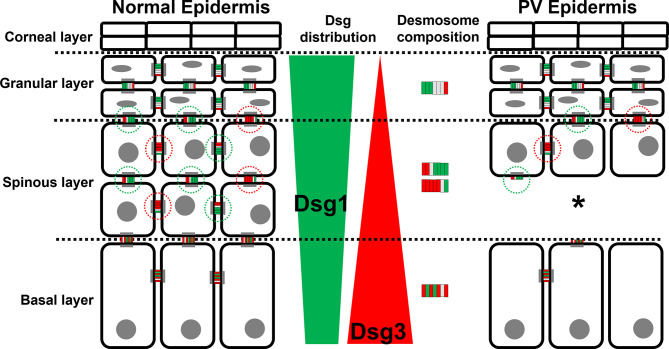
Figure 7.
Schematic depiction of the distribution of the PV autoantigens Dsg1 (green) and Dsg3 (red) and the composition of desmosome along different epidermal layers in normal epidermis (left) and PV-affected epidermis (right). *Significant difference to the value which is indicated that it is compared to.

