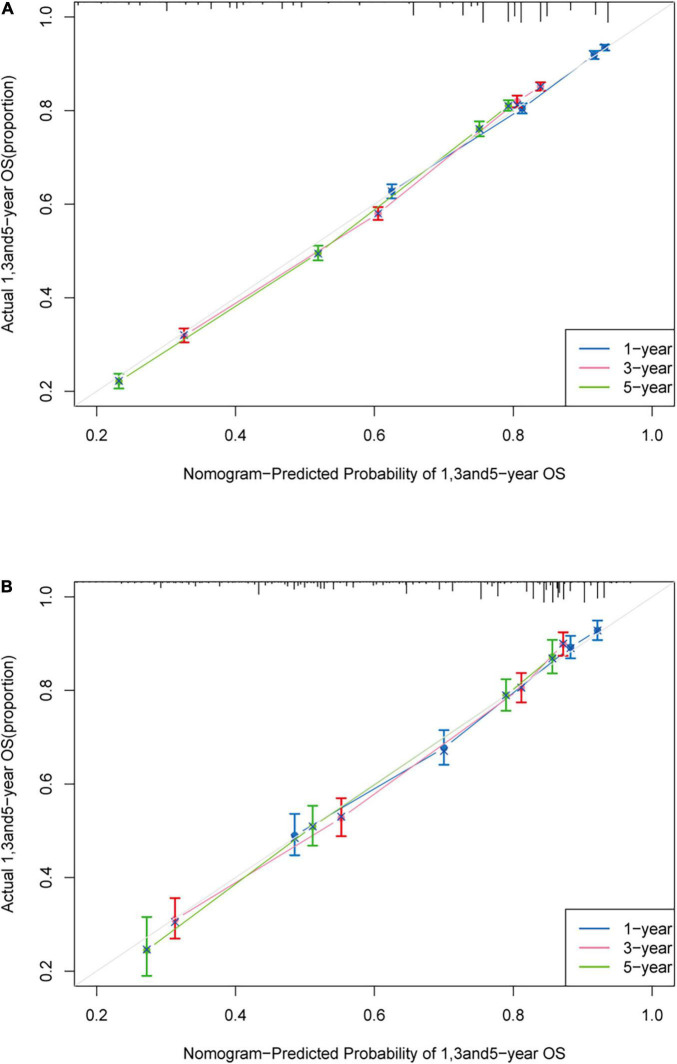
FIGURE 2.
Calibration plot. Calibration curve of the nomogram both in the training and validation cohort. Predicted survival probability produced by nomogram is x-axis, and actual survival is y-axis, close alignment with 45 degrees diagonal represents the good estimation. (A) 1-, 3-, and 5-year OS of the training cohort; (B) 1-, 3-, and 5-year OS of the validation cohort.

