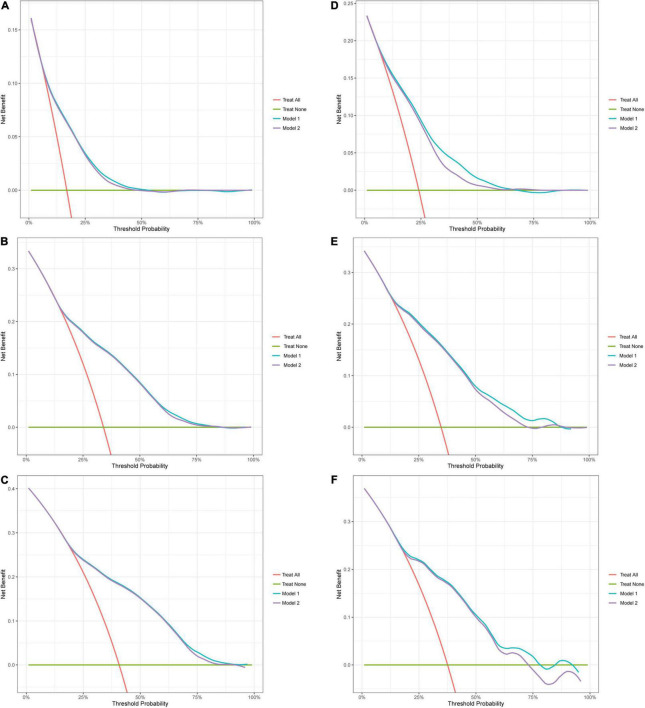
FIGURE 3.
Decision curve analysis (DCA). Decision curve analysis for OS. Red line (Treat all): “all patient dead scheme.” Green line (Treat none): “no patient dead scheme.” Blue line (Model 1): “nomogram model.” Purple line (Model 2): “cancer model.” (A) 1-year DCA in the training cohort; (B) 3-year DCA in the training cohort; (C) 5-year DCA in the training cohort; (D) 1-year DCA in the validation cohort; (E) 3-year DCA in the validation cohort; (F) 5-year DCA in the validation cohort.

