
Figure 3.
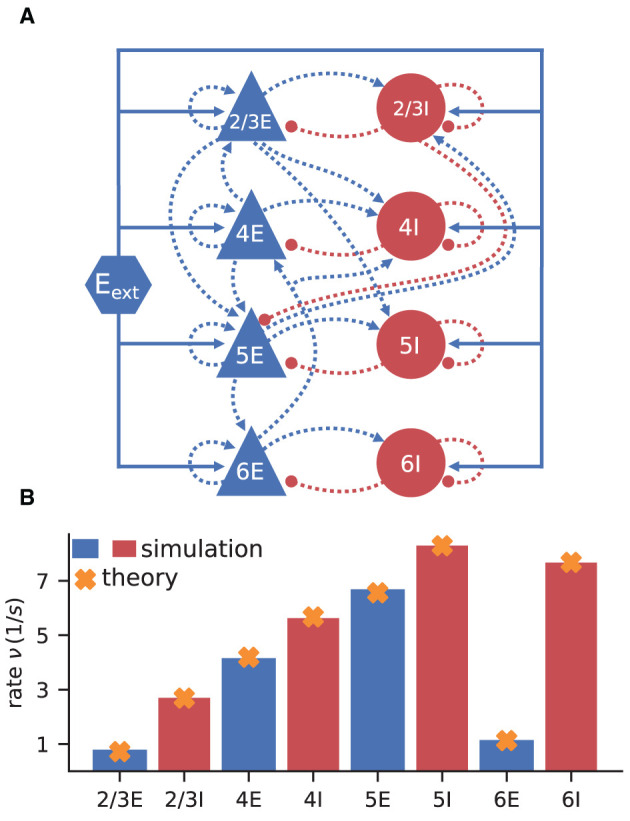
Cortical microcircuit model by Potjans and Diesmann (2014). (A) Network diagram (only the strongest connections are shown as in Figure 1 of the original publication). Same notation as in Figure 2A. (B) Simulation and mean-field estimate for average population firing rates using the parameters from Bos et al. (2016).