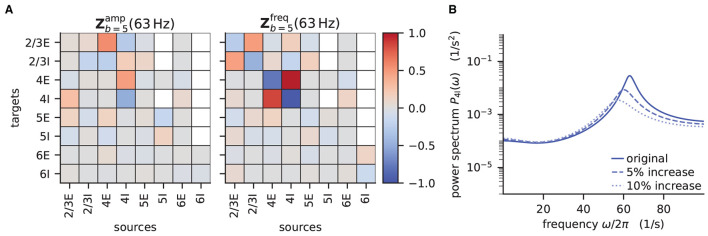
Figure 6.
Sensitivity measure at low-γ frequency and corresponding power spectrum of microcircuit with adjusted connectivity. (A) Sensitivity measure of one eigenmode of the effective connectivity relevant for low-γ oscillations. The sensitivity measure for this mode is evaluated at the frequency where the corresponding eigenvalue is closest to the point of instability 1 + 0i in complex plane. (left subpanel) visualizes the influence of a perturbation of a connection on the peak amplitude of the power spectrum. (right subpanel) shows the impact on the peak frequency. Non-existent connections are masked white. (B) Mean-field prediction of power spectrum of population 4I with original connectivity parameters (solid line), 5% increase (dashed line) and 10% increase (dotted line) in connections K4I → 4I. The increase in inhibitory input to population 4I was counteracted by an increase of the excitatory external input Kext → 4I to maintain the working point.

