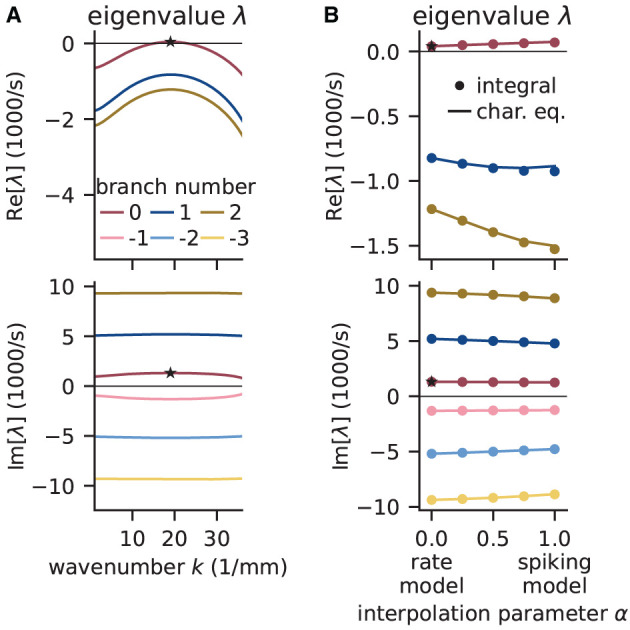
Figure 9.

Linear stability analysis of spatially structured network model. (A) Analytically exact solution for real (top) and imaginary (bottom) part of eigenvalue λ vs. wavenumber k using rate model derived by fit of spiking model at working point (μ, σ) = (10, 10) mV. Color-coded branches of Lambert WB function; maximum real eigenvalue (star marker) on principal branch (B = 0). (B) Linear interpolation between rate (α = 0) and spiking model (α = 1) by numerical integration of Senk et al. (2020, Equation 30) (solid line) and by numerically solving the characteristic equation in Senk et al. (2020, Equation 29) (circular markers). Star markers at same data points as in (A). Similar displays as in Senk et al. (2020, Figure 6).
