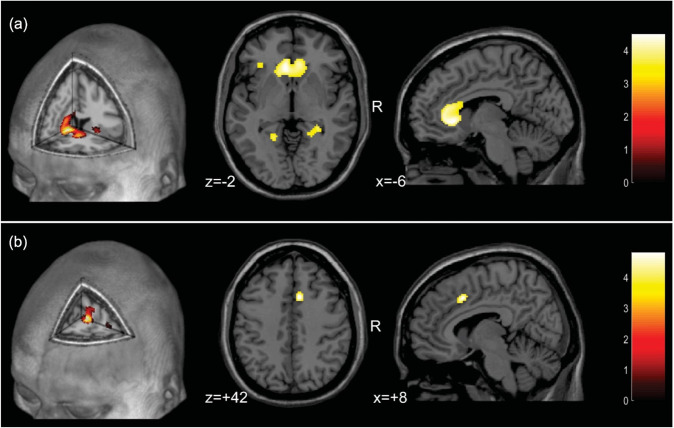
Fig. 3. Brain correlates of visuoconstructional performance in mild COVID-19 patients.
a Findings of negative correlation between performance on the Rey-Osterrieth Complex Figure (ROCF) test and white matter volume (filtered at the Z > 3.29 threshold). The foci show the peak of the greatest significance within the cluster (highlighted in yellow), located in the left and right genu of the corpus callosum, extending to the cingulum bundle; (b) Findings of negative correlation between performance on the ROCF test and glucose metabolism (filtered at the Z > 3.29 threshold). The foci show the peak of the greatest significance within the cluster (highlighted in yellow), located in the right dorsal anterior cingulate gyrus. The colored bar represents the T value. Foci of significance were overlaid on axial brain slices spatially normalized into an approximation to the Talairach and Tournoux stereotactic atlas (Talairach and Tornoux, 1988). Abbreviations: R right. Statistical details are provided in Table 2.

