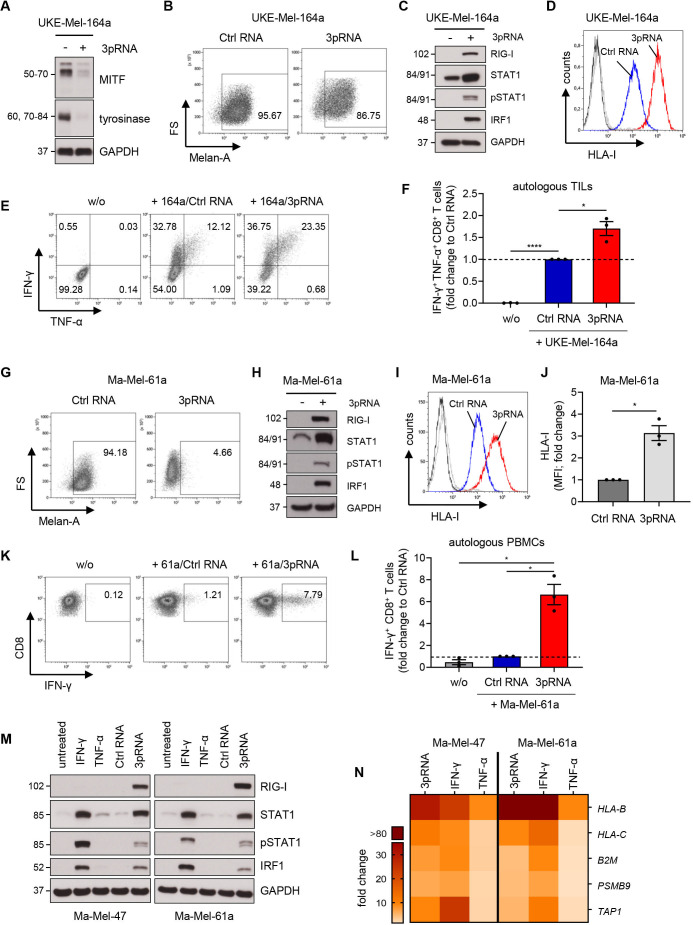
Figure 7.
Strong CD8 T cell reactivity toward 3pRNA-induced dedifferentiated persisters. (A, B and D, F) UKE-Mel-164a cells were transfected twice with 3pRNA (+) or Ctrl RNA (-) and subjected to further analyses on day 7 post-transfection. (A) Differentiation status of UKE-Mel-164a determined by the expression of indicated proteins. GAPDH, loading control. Representative data from three independent experiments. (B) Melan-A expression determined by flow cytometry. Representative histogram from three independent experiments. (C) RIG-I expression and JAK-STAT pathway activation analyzed 24 hours post-transfection by western blot. GAPDH, loading control. Representative data from three independent experiments. (D) HLA-I cell surface expression measured by flow cytometry. Representative histogram from three independent experiments. (E, F) Activation of autologous TILs by UKE-Mel-164a cells transfected with 3pRNA or Ctrl RNA analyzed by intracellular cytokine staining in flow cytometry. (E) Representative dot plot and (F) quantification of IFN-γ+ TNF-α+ CD8+ TILs. Fold change given as mean±SEM from three independent experiments. (G–L) Ma-Mel-61a melanoma cells were transfected with 3pRNA (+) or Ctrl RNA (-) and subjected to further analyses on day 1 (H) or day 3 (G, I–L) post-transfection. (G) Melan-A expression analyzed by flow cytometry. Representative data from three independent experiments. (H) RIG-I expression and JAK-STAT pathway activation analyzed on day 1 post-transfection by western blot. GAPDH, loading control. Representative data from three independent experiments. (I, J) HLA-I cell surface expression measured by flow cytometry. (I) Representative histogram and (J) fold change of MFI given as mean±SEM from three independent experiments. (K, L) Activation of autologous T cells by Ma-Mel-61a cells transfected with 3pRNA or Ctrl RNA analyzed by intracellular IFN-γ staining in flow cytometry. (K) Representative dot plot and (L) quantification of IFN-γ+ CD8+ T cells. Fold change given as mean±SEM from two independent experiments. (M) RIG-I and JAK/STAT pathway activation analyzed 24 hours post-transfection with 3pRNA or Ctrl RNA or post-treatment with IFN-γ or TNF-α by western blot. GAPDH, loading control. Representative data from two independent experiments. (N) Relative mRNA expression of genes involved in antigen processing and presentation in Ma-Mel-47 and Ma-Mel-61a cells on day 3 post-3pRNA transfection or post-cytokine treatment. Fold change given as mean from two independent experiments. Significantly different experimental groups: *p<0.05; ****p<0.001 by two-tailed paired t-test. Ctrl, control; IFN, interferon; MITF, Microphthalmia-associated transcription factor; PBMC, peripheral blood mononuclear cell; RIG-I, retinoic acid-inducible gene I; TIL, tumor-infiltrating T lymphocyte; TNF, tumor necrosis factor, w/o: without target cells.

