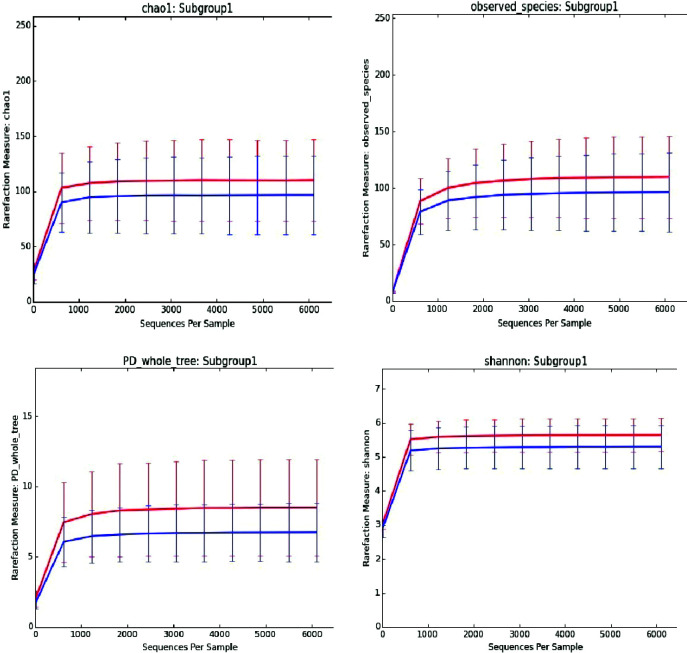
Fig. 5.
Average gut microbiota biodiversity of the 43 stool samples analyzed by 16S rRNA microbial profiling metagenomics techniques of the patients with normal pregnancy (blue) and Down syndrome resulting pregnancy (red). The curves represent the average Chao1 index (up left), observed species (up right), PD whole tree (down left) and Shannon index (down right), corresponding to the number of Operational Taxonomic Units (OTUs), at increasing sequencing depth.

