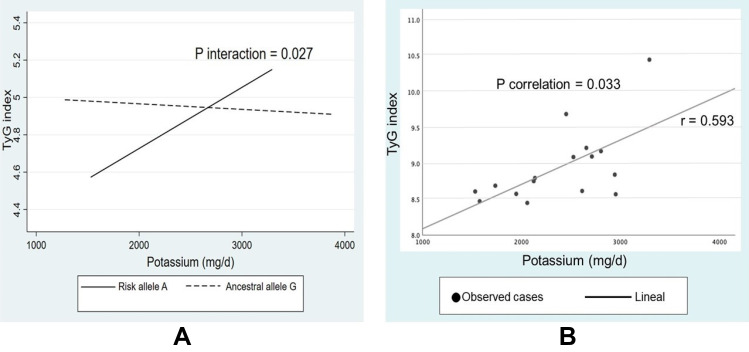
Figure 2.
Interaction and correlation between dietary potassium and OCT1 polymorphism regarding the TyG index. (A) Interaction between dietary Potassium and OCT1 polymorphism regarding the TyG index values. (B) Correlation between dietary potassium and TyG index values within risk allele A carriers + metformin monotherapy, adjusted by age, s ex and energy intake.

