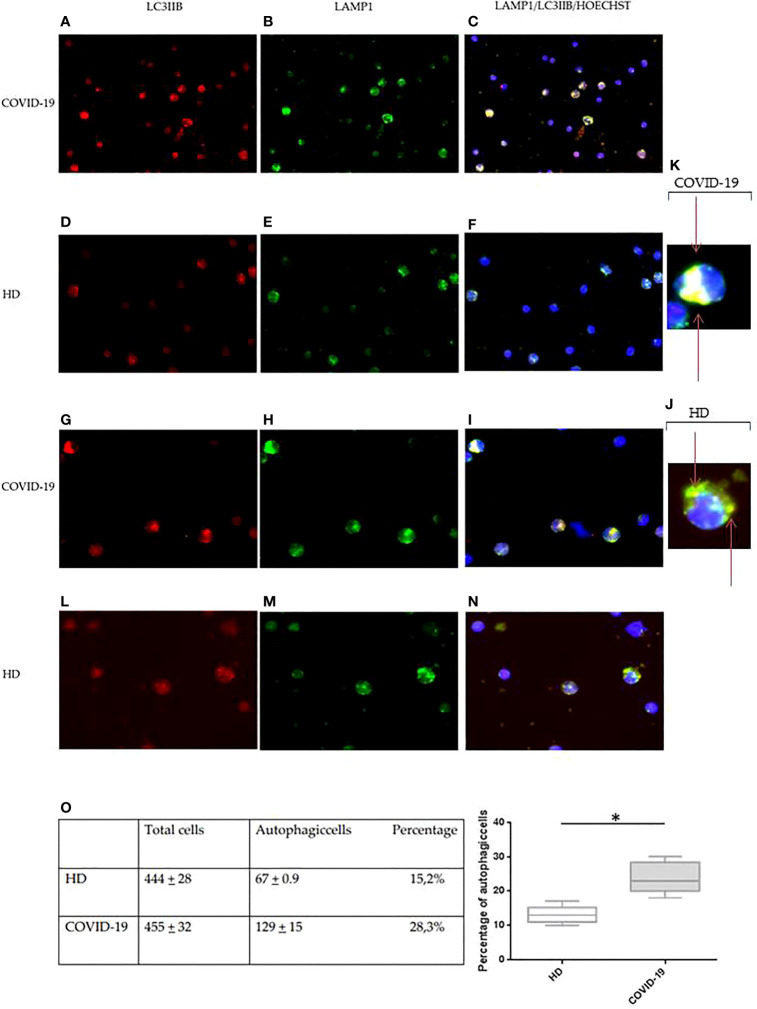
Figure 4.
Immunofluorescence analysis of autophagy in PBMCs from COVID-19 patients and HDs. LC3IIB (red fluorescence) and LAMP1 (green fluorescence) expression in PBMCs from COVID-19 patients (A, B, G, H) and HDs (D, E, L, M). Intracellular autophagolysosome formation detection by colocalization between LC3IIB and LAMP1 (yellow fluorescence) in PBMCs from COVID-19 patients (C, I) and HDs (F, N). (A–F) Magnification, 50×. (G-I, L-N) Magnification, 100×. (J, K) Magnification, x200. (O) Table of total cells and autophagic cells percentage and analysis of the percentage of autophagic cells in COVID-19 and HD PBMCs (Student’s t-test). Values are expressed as means ± SD. *p < 0.05. PBMC, peripheral blood mononuclear cell; COVID-19, coronavirus disease 2019; HDs, healthy donors.

