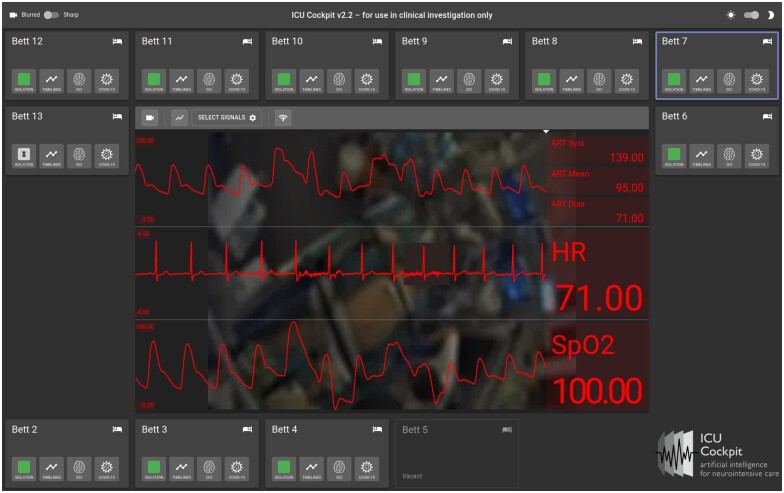
Figure 2.
A snapshot of the icuUI feed. The neurocritical care unit has 12 beds. Bed 7 (“Bett 7”) has been selected for display in the central panel. The live webcam video feed from Bed 7 is shown with 3 signals overlaid as charts in the central display panel. The patient face has been masked. Top: ART (arterial blood pressure waveform), Middle: ECG, Bottom: pulse oximetry. Related parametric values (systolic, diastolic and mean arterial blood pressure, heart rate (HR) and Spo2) that are calculated once per second are shown as numbers on the right of each signal. Boxes for each bed additionally contain analytics and metadata such as Covid isolation status (green = not infected), data timelines (‘Timelines’) and algorithm outputs (cf, DCI prediction).

