
Figure 4.
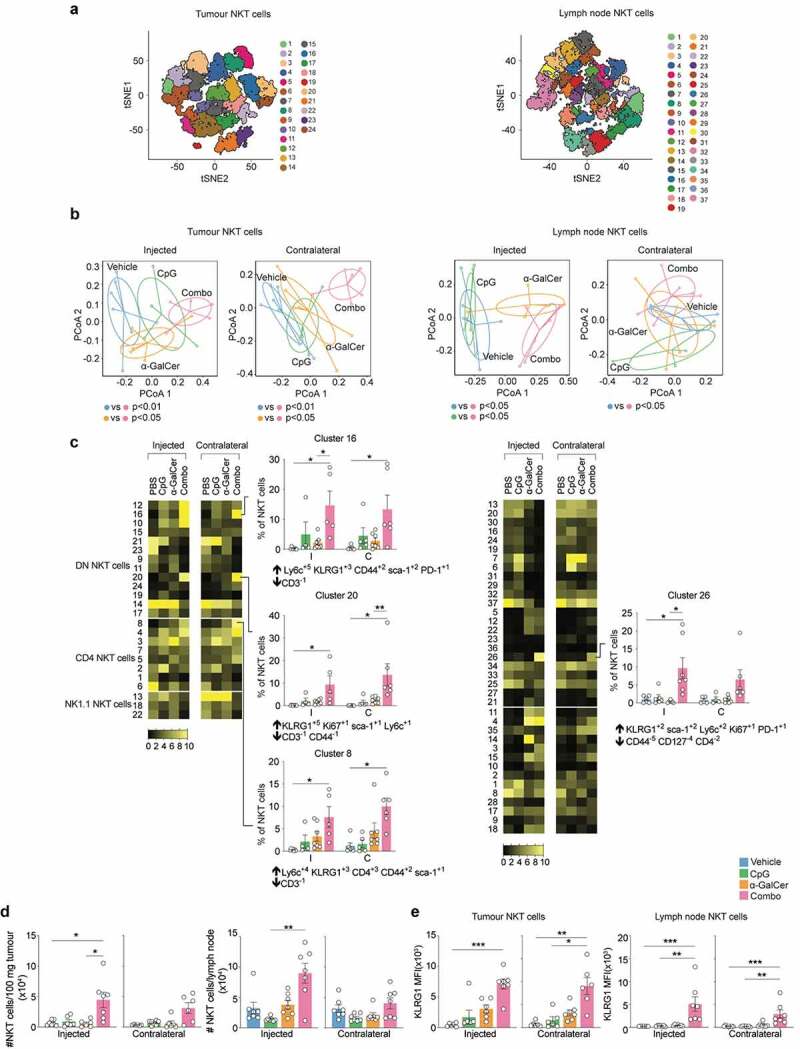
Spectral flow cytometry analysis of leukocytes after treatment. Treatment was as in Figure 3, except E.G7-OVA tumours were implanted on both flanks, with only one subjected to intratumoural injection (n = 7 per treatment group). Tissues were collected for analysis 12 days after tumour injection. The gating strategy in Supplementary Figure 2 was used to define T cells, NK cells and NKT cells (a) tSNE analysis was performed for each cell type, with FlowSOM then conducted on tSNE axes to assign clusters (numbered). (b) PERMANOVA was conducted to assess dissimilarity in the composition of clusters with treatment (further results in Supplementary Figures 4–6). Derived dissimilarity plots from the analysis of NKT cell clusters in each tissue are shown, along with significance of pairwise comparisons between the treatments. (c) Heatmaps showing proportion of NKT cells in each cluster compared by treatment conditions. Graphs and MEM labels are shown for clusters where there were significant differences between the combination treatment group and the other groups. Up arrows indicate positively enriched markers, and down arrows indicate negatively enriched markers *p < .05 **p < .01 ***p < .001; Indicator species analysis. (d) Assessment of NKT cell number in the tumour and tumour dLN by manual gating. NKT cells defined as CD3ε+ CD1d tetramer+ cells. (e) Assessment of KLRG1 expression on NKT cells by manual gating. Kruskal-Wallis with Dunn’s multiple comparisons test; *p < .05, **p < .01, ***p < .001.