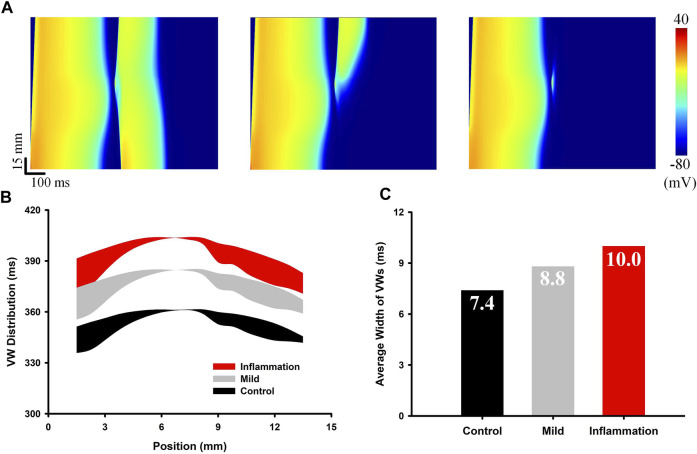
FIGURE 4.
Measurement of the VW in the 1-D strand model under normal, mild inflammatory, and extreme inflammatory conditions. (A) The three subplots from left to right show the bidirectional conduction, the unidirectional conduction block, and the bidirectional conduction block. (B) Distributions of VWs across the strand. Black and red belts represent the control and inflammatory conditions, respectively. (C) Comparison of the average width of the VWs in the three groups.

