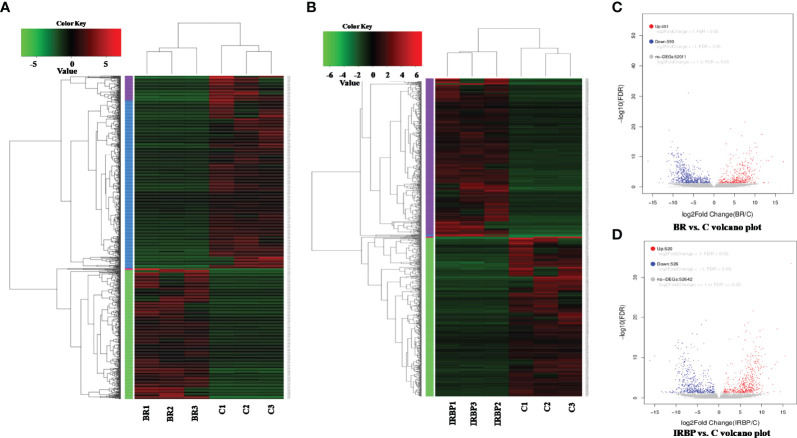
Figure 6.
Heatmap and volcano plot of the DEGs in different samples. The heatmap indicates that the expression patterns were significantly different in the eyes of BR14-induced animals (A) and IRBP-induced animals (B) compared to those of the control group. BR: Eyes in the BR14-induced group. IRBP: Eyes in the IRBP-induced group. C: Eyes in the healthy control group. (C) A volcano plot of the DEGs shows 401 upregulated genes (red dots) and 590 downregulated genes (blue dots) in the eyes of the BR14–induced group compared to the control group. (D) A volcano plot of the DEGs shows 520 upregulated genes (red dots) and 526 downregulated genes (blue dots) in the eyes of the IRBP-induced group compared to the control group.

