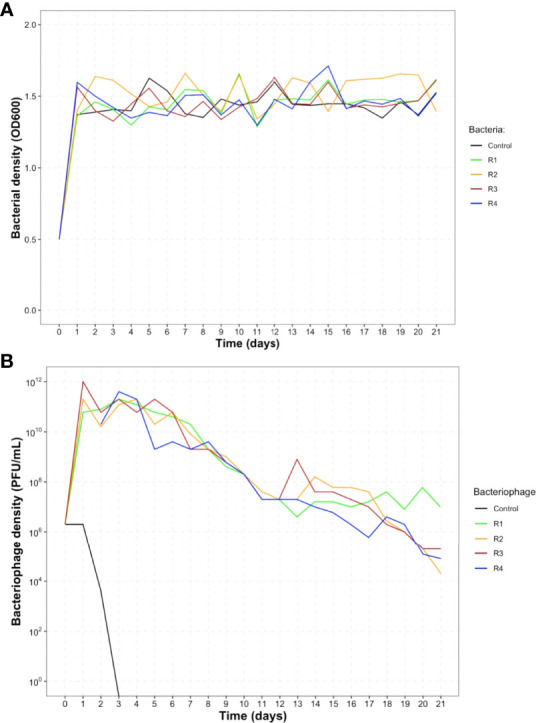
Figure 2.

Population density of S. Enteritidis and a lytic phage for 21 days. (A) Population density of S. Enteritidis for the 21 days of experimental coevolution. (B) Phage titer for the 21 days of experimental coevolution. For both, the control without the phage/bacteria are in black, and the four replicates are identified as replicate 1 (R1) in green, replicate 2 (R2) in orange, replicate 3 (R3) in red, and replicate 4 (R4) in blue. For both charts, day 0 corresponds to the time of the infection and day 1, 24 hours later.
