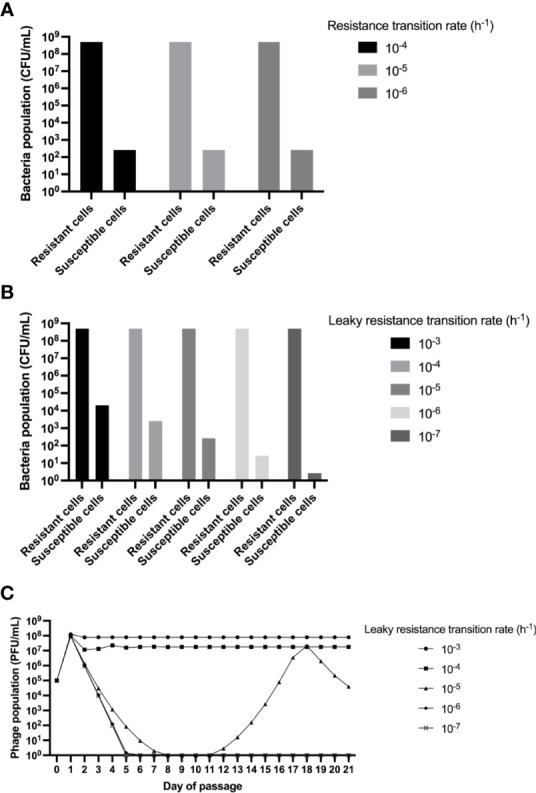
Figure 3.

Mathematical model and simulations. Computer simulation results for the changes in the densities of phage populations. Unless otherwise stated, the parameters used to simulate were: k=1, e= 5·10-7 μg/cell, v 2.0 h-1, δ=2·10-7 h-1cell-1, β=60 phages/cell. (A) Changes in phage densities after 23 hours when testing different values of μN. (B) Changes in phage densities after 23 hours when testing different values of μR. (C) Changes in phage densities for 21 days of serial passage (dilution factor of 0.01) when testing different values of μR.
