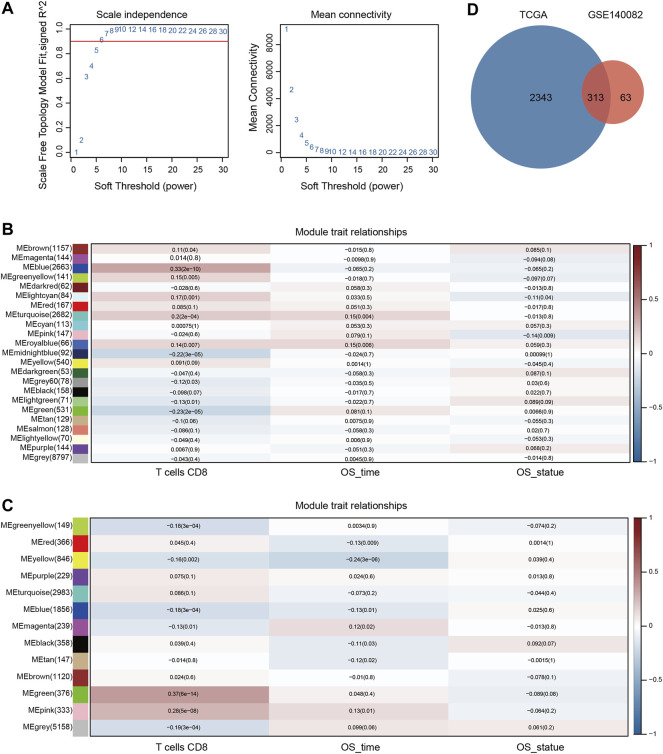
FIGURE 1.
Identification of key modules correlated with OC via WGCNA. (A) Analysis of the scale-free fit index and the average connectivity of various soft threshold power. Heatmap of the association between module eigengenes and status (CD8+ T cell infiltration, OS time, and OS statue) in the TCGA-OV (B) and GSE140082 (C) cohort. The corresponding correlation coefficient and P value were presented in each cell. (D) The intersection of CD8+ T cell related genes from the two cohorts.

