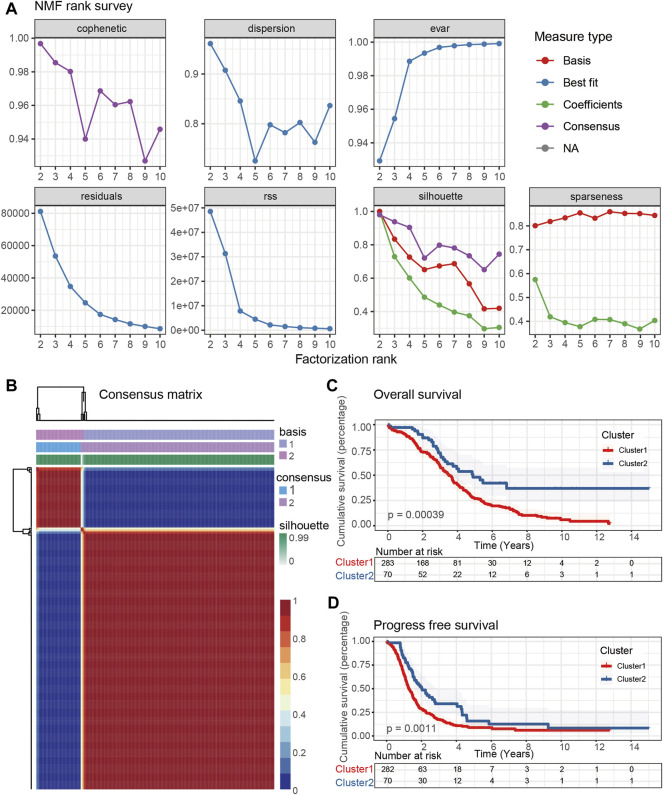
FIGURE 2.
Identification of the molecular subtypes of OC patients using NMF. (A) The cophenetic, dispersion, evar, residuals, rss, silhouette, and sparseness distributions when rank k was set as 2 to 10. (B) Consensus map of NMF clustering for k = 2, which was the optimal cluster number in the TCGA-OV cohort. Kaplan-Meier (K-M) survival analyses were used to determine the OS (C) and PFS (D) prognosis of OC patients in two sub-consensuses classifications.

