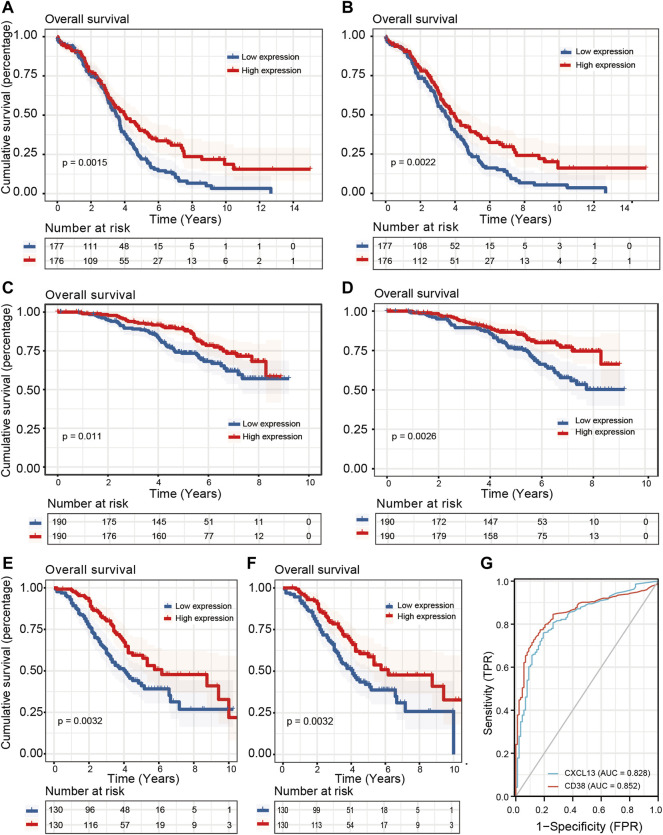
FIGURE 6.
Prognostic value and diagnostic capacity of CD38 and CXCL13 in three OC cohorts. Kaplan-Meier curves were employed to show the correlation between CD38/CXCL13 expression and OS in (A,B) TCGA-OV, (C,D) GSE140082, and (E,F) GSE32062 cohorts. (G) The ROC curve was employed to evaluate the diagnostic capacity of CD38 and CXCL13 in OC.

