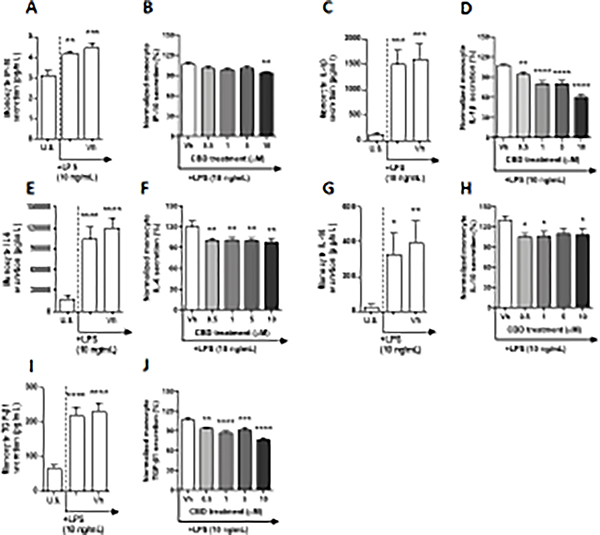
Fig. 3. The effect of CBD on TLR 4 activated monocytes.
Monocytes were either unstimulated (U.S.), activated with TLR 4 agonist, LPS, at 10 ng/mL (activation only control), or activated with LPS in combination with vehicle (0.03% ethanol; Vh), then cultured for 22 hours (A, C, E, G, and I). These graphs present the unnormalized concentration of each cytokine and chemokine. Asterisks denote statistically significant differences compared to U.S. (*p < 0.05, **p < 0.01, ***p < 0.001, ****p < 0.0001) as determined by repeated measures one-way ANOVA with Sidak’s post-hoc test. Monocytes were activated with LPS and treated with Vh or CBD (0.5, 1, 5, or 10 μM), then cultured for 22 hours (B, D, F, H, and J). After quantification of cytokine and chemokine, values were normalized to the LPS activation only control and presented as a percentage. Asterisks denote statistically significant differences from the Vh control in each graph (*p < 0.05, **p < 0.01, ***p < 0.001, ****p < 0.0001) as determined by repeated measures one-way ANOVA with Dunnett’s post-hoc test. All graphs are means S.E.M. (A-J) (n = 6).

