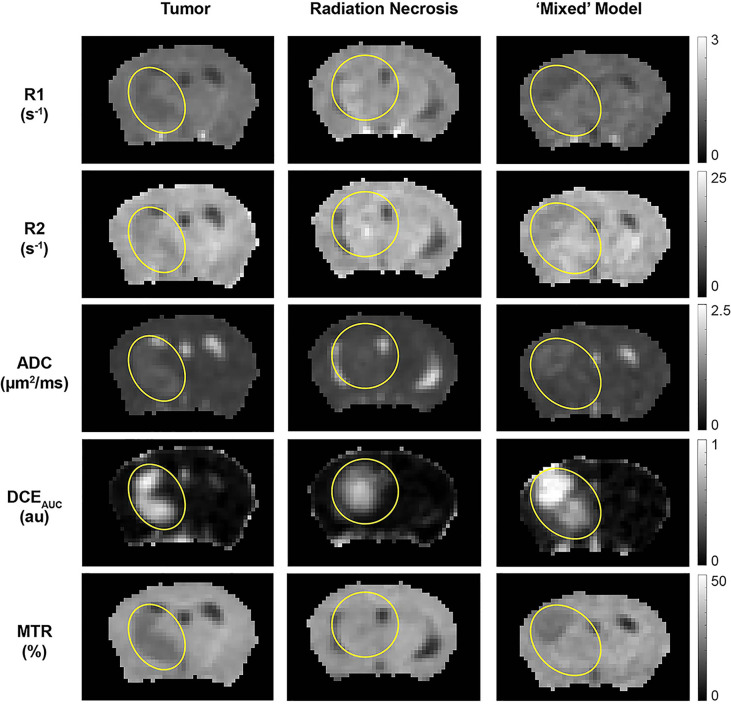
Figure 4.
Parametric maps, derived from the 1H MRI pipeline of (left) pure tumor; (middle) pure radiation necrosis, and (right) mixed model. From top to bottom, maps are shown of R1 (= 1/T1), R2 (= 1/T2), apparent diffusion coefficient (ADC), DCE area under the curve (AUC), and magnetization transfer ratio (MTR). Yellow circles/ovals guide the eye to the locations of lesions in each of these maps.

