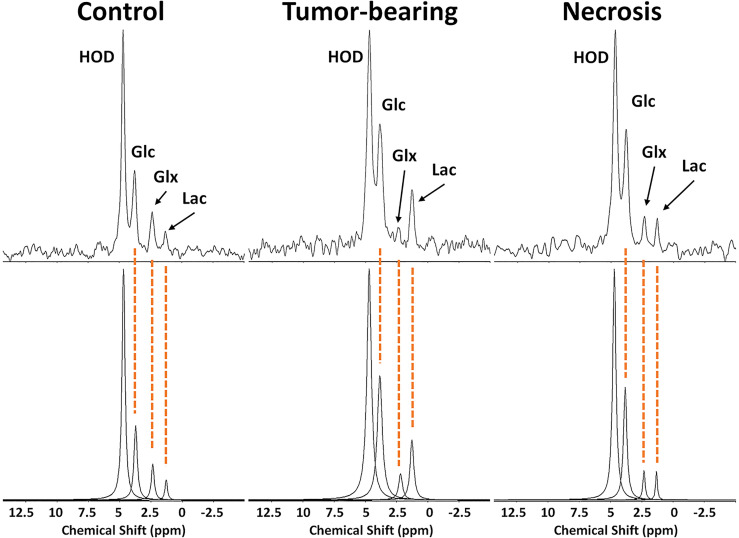
Figure 8.
(top) 2H MR spectra created by summation of nine 10-min acquisitions during administration of Glc for (left) control, non-lesion-bearing mouse; (middle) pure tumor; (right) pure radiation necrosis. (bottom) Results of Bayesian modeling of these spectra. Estimates and uncertainties of resonance frequencies, amplitudes, and linewidths derived from decay-rate constants (R2*) for these spectra are summarized in Supplementary Data, Table S1 .

