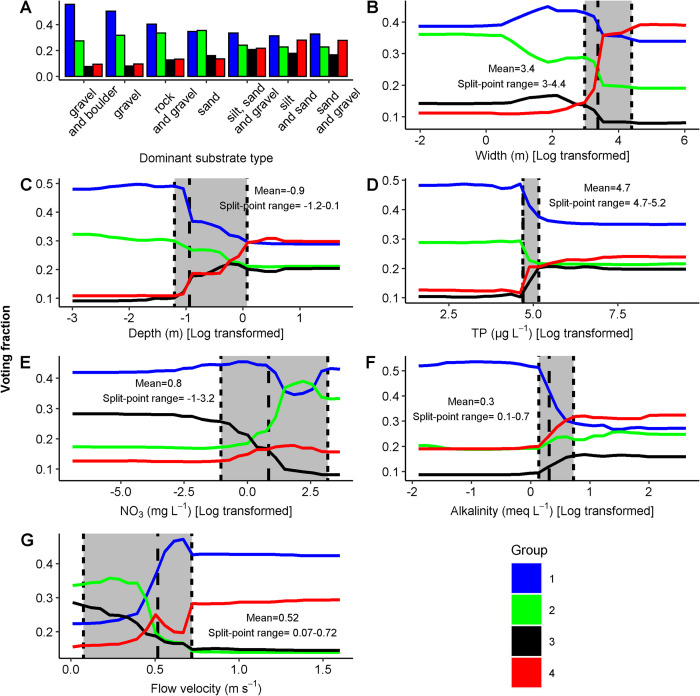
Fig 3. Partial dependency plots of Groups 1–4 displaying predictions of the RF model.
A) dominant substrate type, B) width, C) total phosphorus, D) depth, E) alkalinity, F) nitrate and G) flow velocity. Grey coloured areas indicate the split-point range representing the minimum and maximum values extracted from the root-nodes for each generated tree. The two dotted lines indicate the minimum and maximum values and the dashed line indicates the mean. Variables are log-transformed for visualization (natural logarithm).

