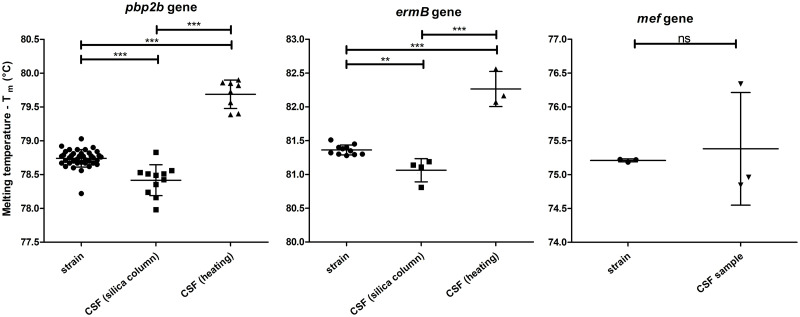
Fig 1. Mean of the Melting Temperature (Tm) values for all replicates for each DNA extracted from strain or CSF sample by silica column or by heating.
Each column represents the data obtained for one gene which is identified at the top. Short horizontal bars indicate the mean; Vertical bars show the standard deviation; Long horizontal bars represent the significance of differences calculated by the Tukey’s Multiple Comparison Test and shown by asterisks: **P < 0.01 and ***P < 0.001. For the mef gene, it was calculated by unpaired t-test: ns means not significant (P > 0.05).

