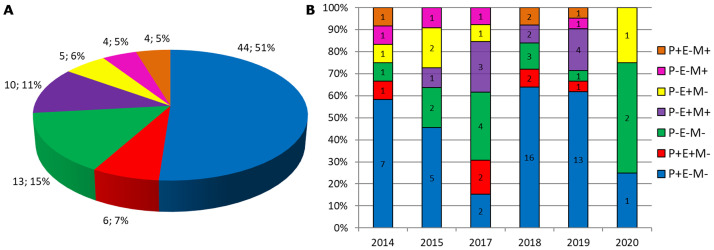
Fig 3. Genetic profile of resistance genes detected in all strains or CSF samples received from 2014 to 2020: A—Distribution in percent of all 86 samples per genotype; B—Distribution in percent per year of all 86 samples.
The total of results per genotype is indicated inside of each bar; Genotypes: P+E-M- means pbp2b positive, ermB and mef negative; P+E+M- means pbp2b and ermB positive and mef negative; P-E-M- means pbp2b, ermB and mef negative; P-E+M+ means pbp2b negative, ermB and mef positive; P-E+M- means pbp2b and mef negative, and ermB positive; P-E-M+ means pbp2b and ermB negative, and mef positive; P+E-M+ means pbp2b and mef positive, and ermB negative.

