
Fig. 2.
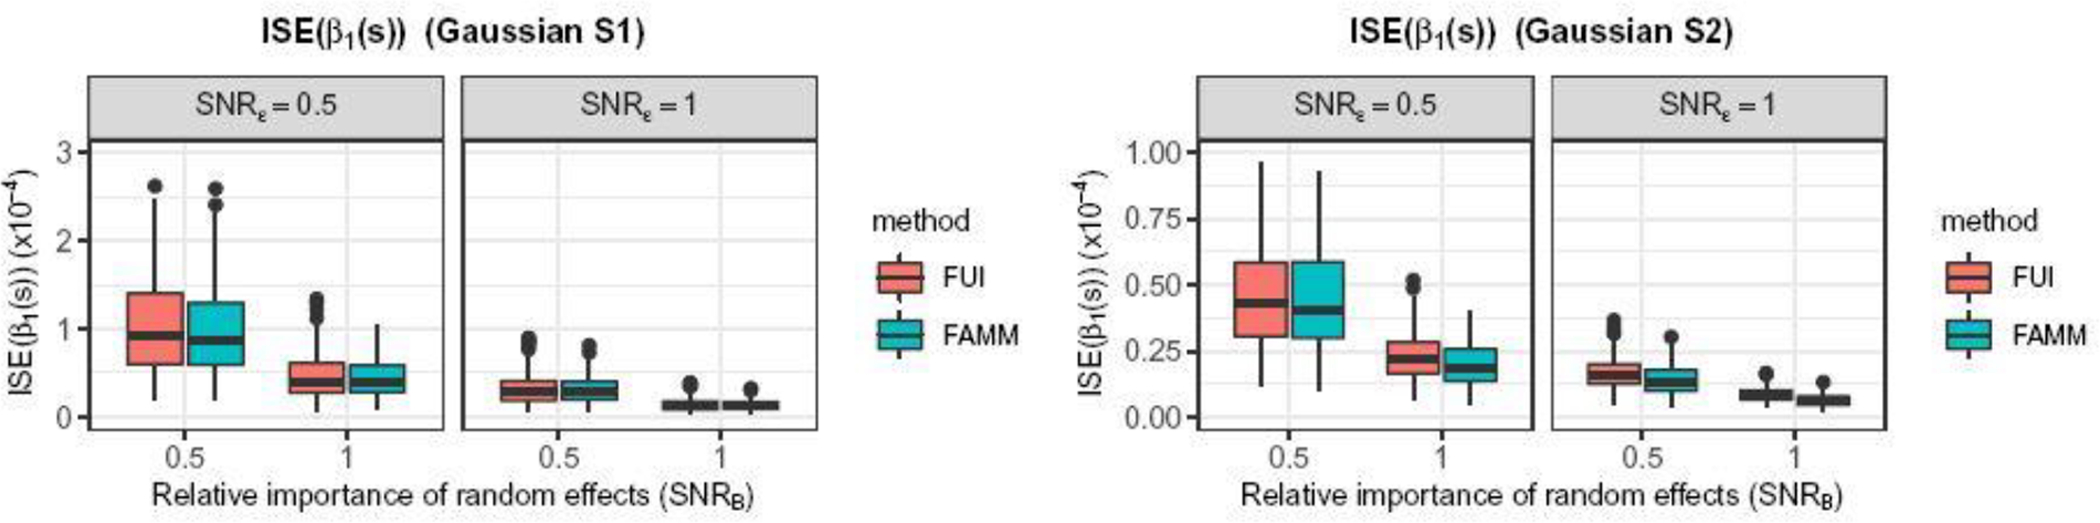
Estimation accuracy for FUI (red) and FAMM (blue) under different relative importance of random effects (SNRB, x axis) and signal-to-noise ratios (SNRϵ, labels in the gray-shaded area of each panel). Functional response is Gaussian; parameters: I = 50, J = 5, L = 50. Left two panels: S1. Right two panels: S2.