
Fig. 5.
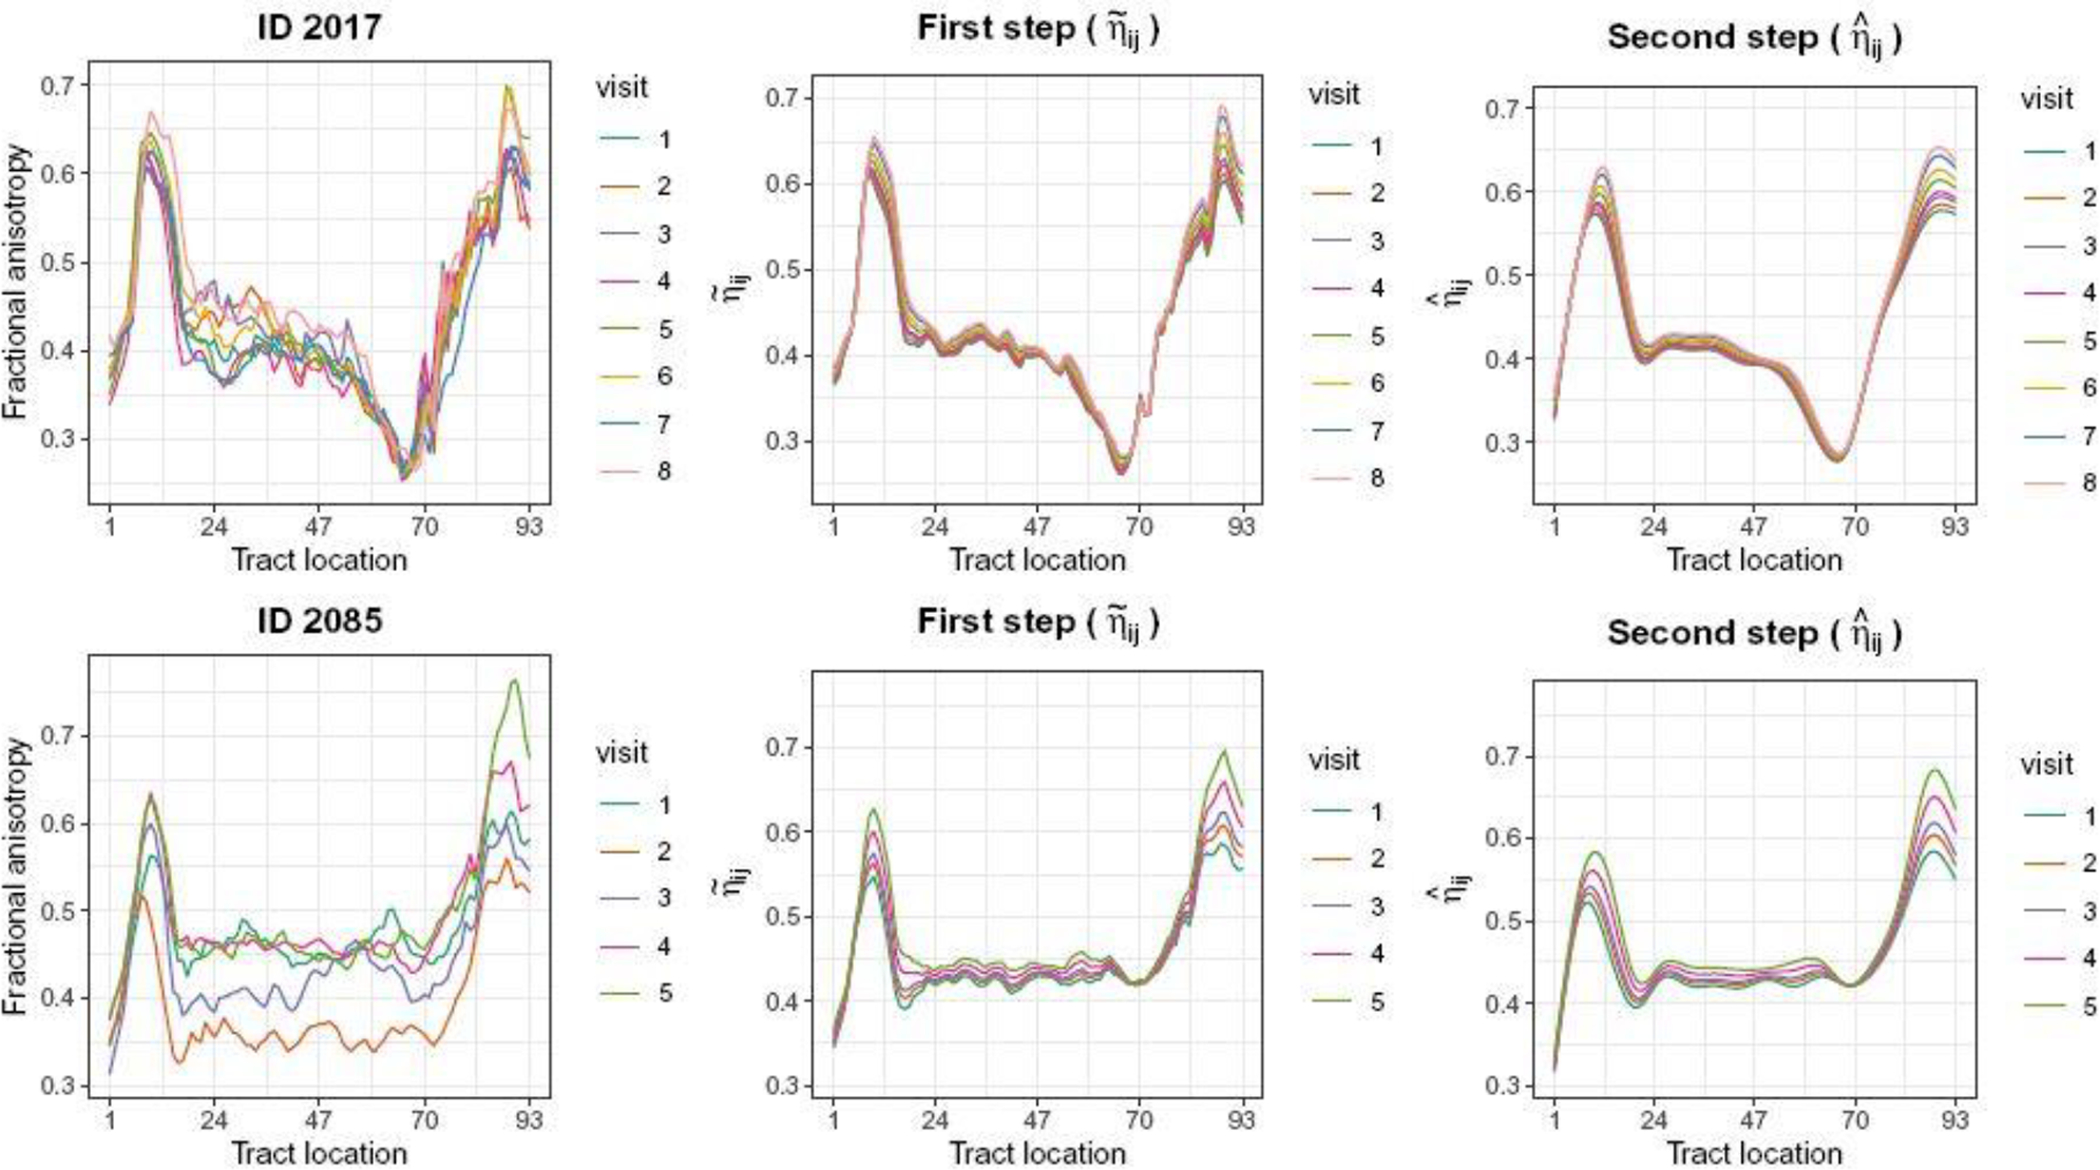
Fractional anisotropy (FA) tract profiles and estimated predictors for two study participants (first row: ID 2017, second row: ID 2085). First column: FA tract profiles for the corpus callosum over multiple visits. Second column: pointwise estimated predictor . Third column: smoothed estimated predictor of the pointwise predictors.