
Fig. 6.
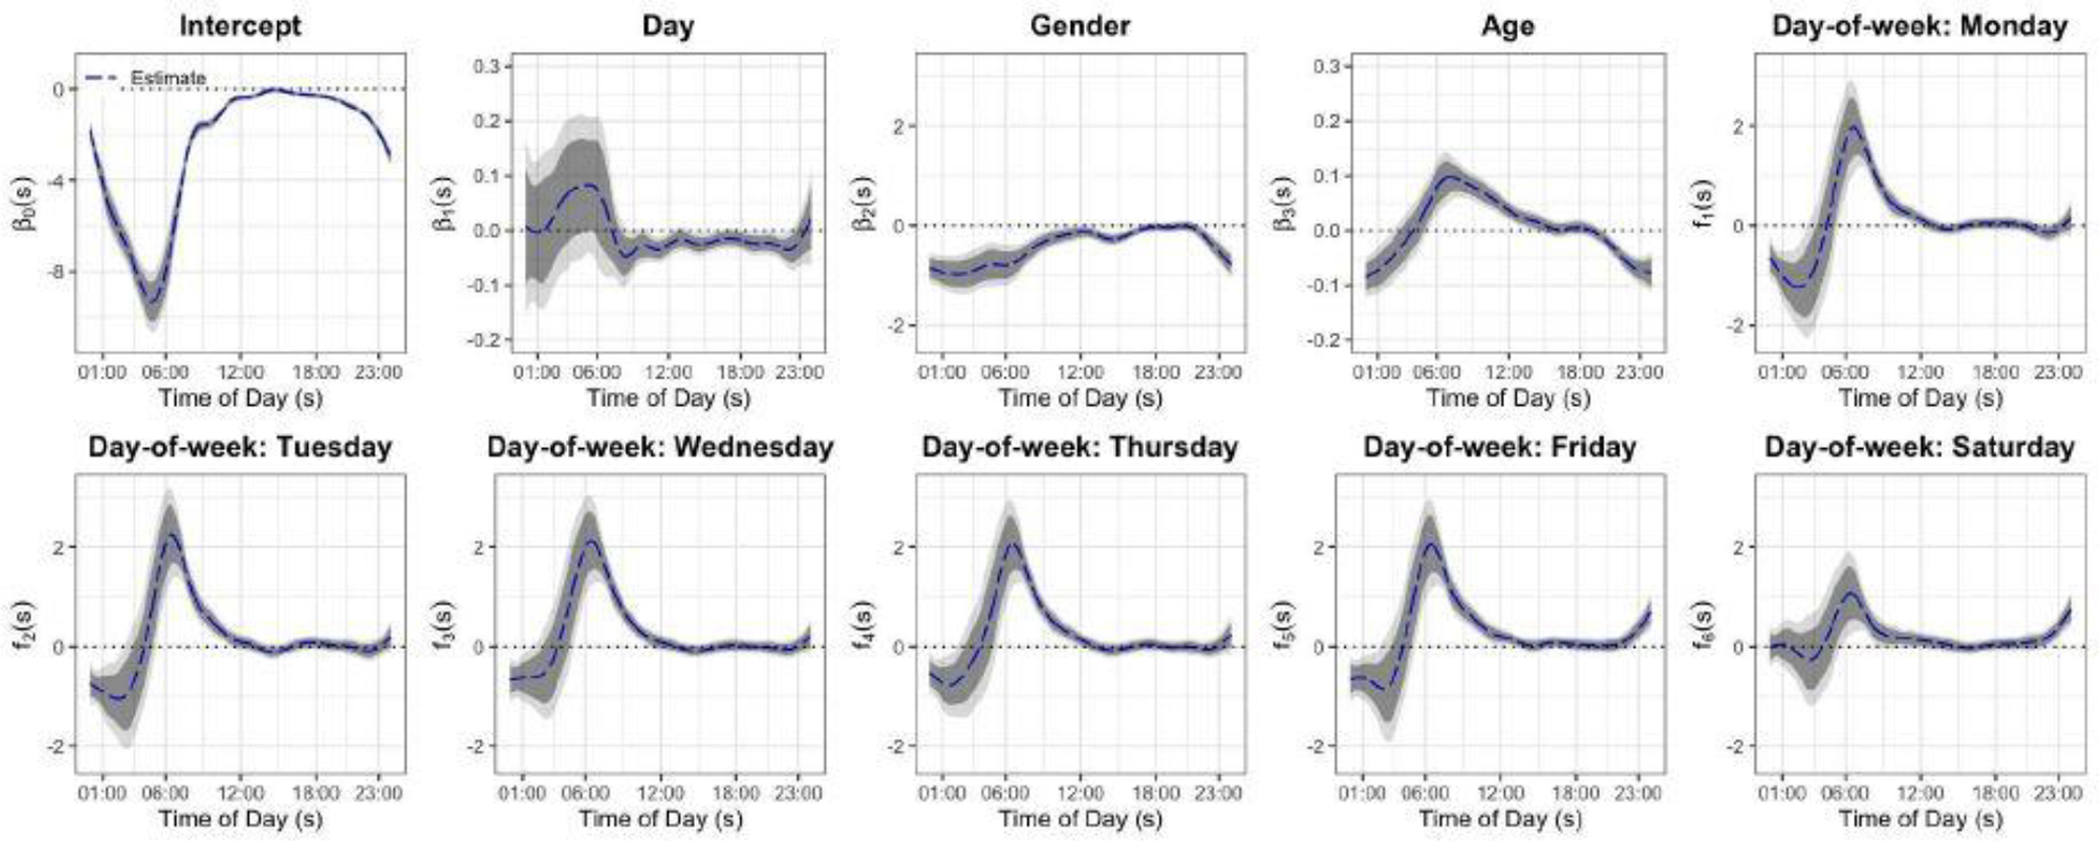
Estimated coefficients from the NHANES data application. Smoothed coefficient estimates are denoted using blue dashed lines. Pointwise and joint 95% confidence intervals are shown as the dark and light gray shaded area, respectively.
Official websites use .gov
A
.gov website belongs to an official
government organization in the United States.
Secure .gov websites use HTTPS
A lock (
) or https:// means you've safely
connected to the .gov website. Share sensitive
information only on official, secure websites.
Estimated coefficients from the NHANES data application. Smoothed coefficient estimates are denoted using blue dashed lines. Pointwise and joint 95% confidence intervals are shown as the dark and light gray shaded area, respectively.