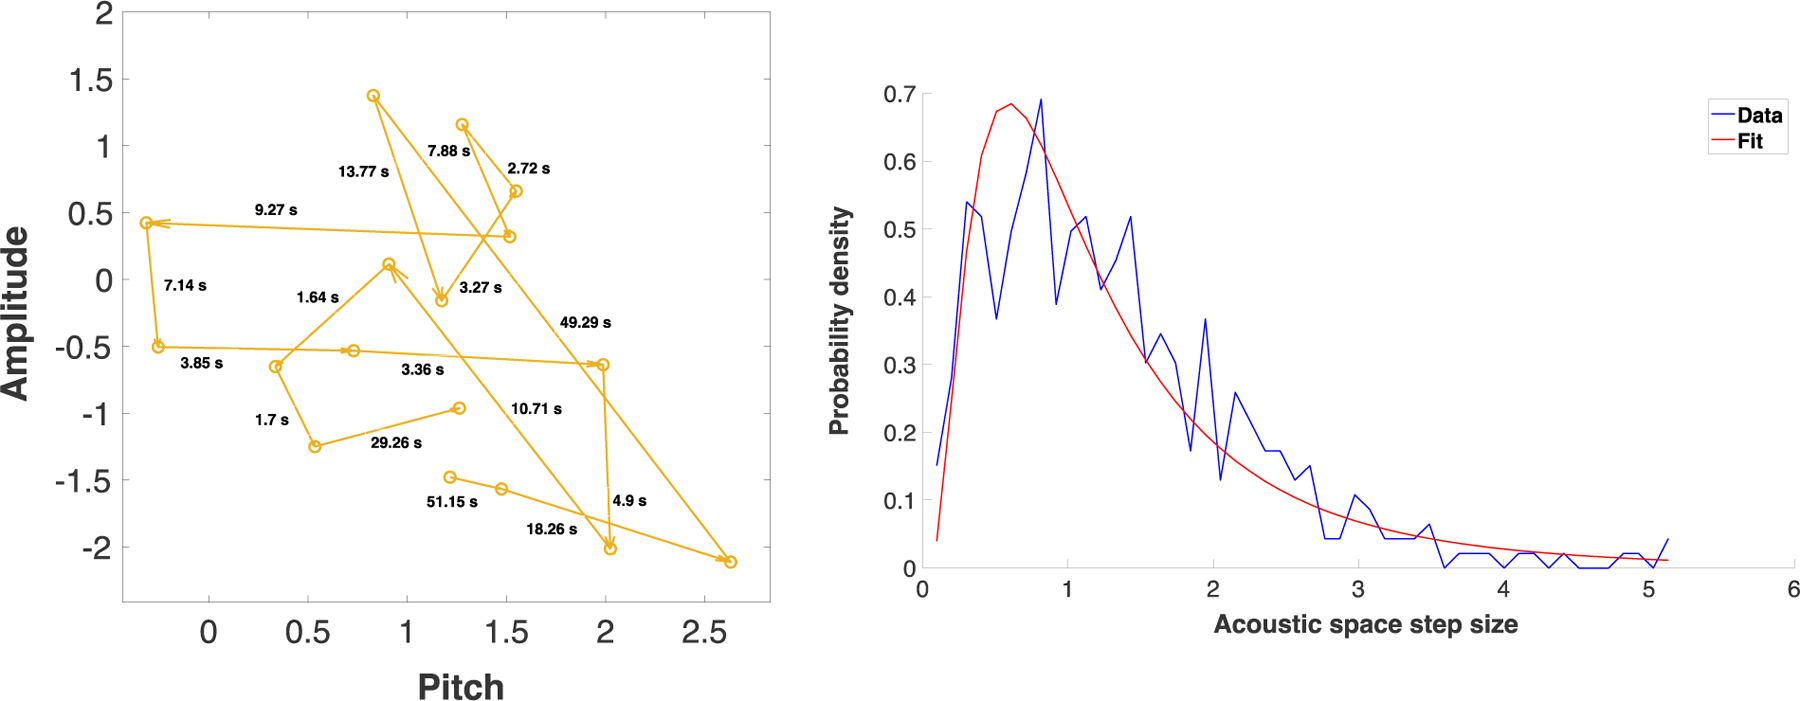
Figure 2.

Left: A sample of some of the vocalization “movements”, a.k.a. “steps”, of a 3-month-old infant. Each point represents a single vocalization. The horizontal axis represents the mean pitch of the vocalization (log-transformed and normalized with respect to the entire infant vocalization dataset of Ritwika et al., 2020). The vertical axis represents the mean intensity of the vocalization in dB (also normalized). Each arrow corresponds to one step between consecutive infant pre-speech sounds. The numbers next to each arrow represent the duration of time that elapsed between the two vocalizations (i.e., the inter-vocalization interval). Acoustic space step size was defined as the distance in the two plotted acoustic dimensions between the two vocalization points. Right: An example of acoustic step size distribution for a 2-month-old infant’s recording, focusing on the infant’s pre-speech sounds and specifically on steps where the first vocalization did not receive an adult response. The x-axis plots the acoustic space step size (i.e., the difference, taking into account both pitch and amplitude, between two consecutive infant vocalizations). The y-axis shows the likelihood of observing steps of a given size. It can be seen that smaller step sizes are generally more frequent, but that larger step sizes (spanning more than 2 and up to 5 standard deviations in the acoustic dimensions) do occur. The blue curve shows the histogram of step sizes from the raw data. In this case a lognormal distribution was the best type of function to fit that histogram. The lognormal fit is shown by the red curve. The specific parameters of lognormal fits can be compared across recordings and interactive contexts. This can provide information about how infant vocal dynamics change, such as with age or related to whether the infant is or is not engaged in vocal interaction with caregivers. Right panel adapted from Ritwika et al. (2020).
