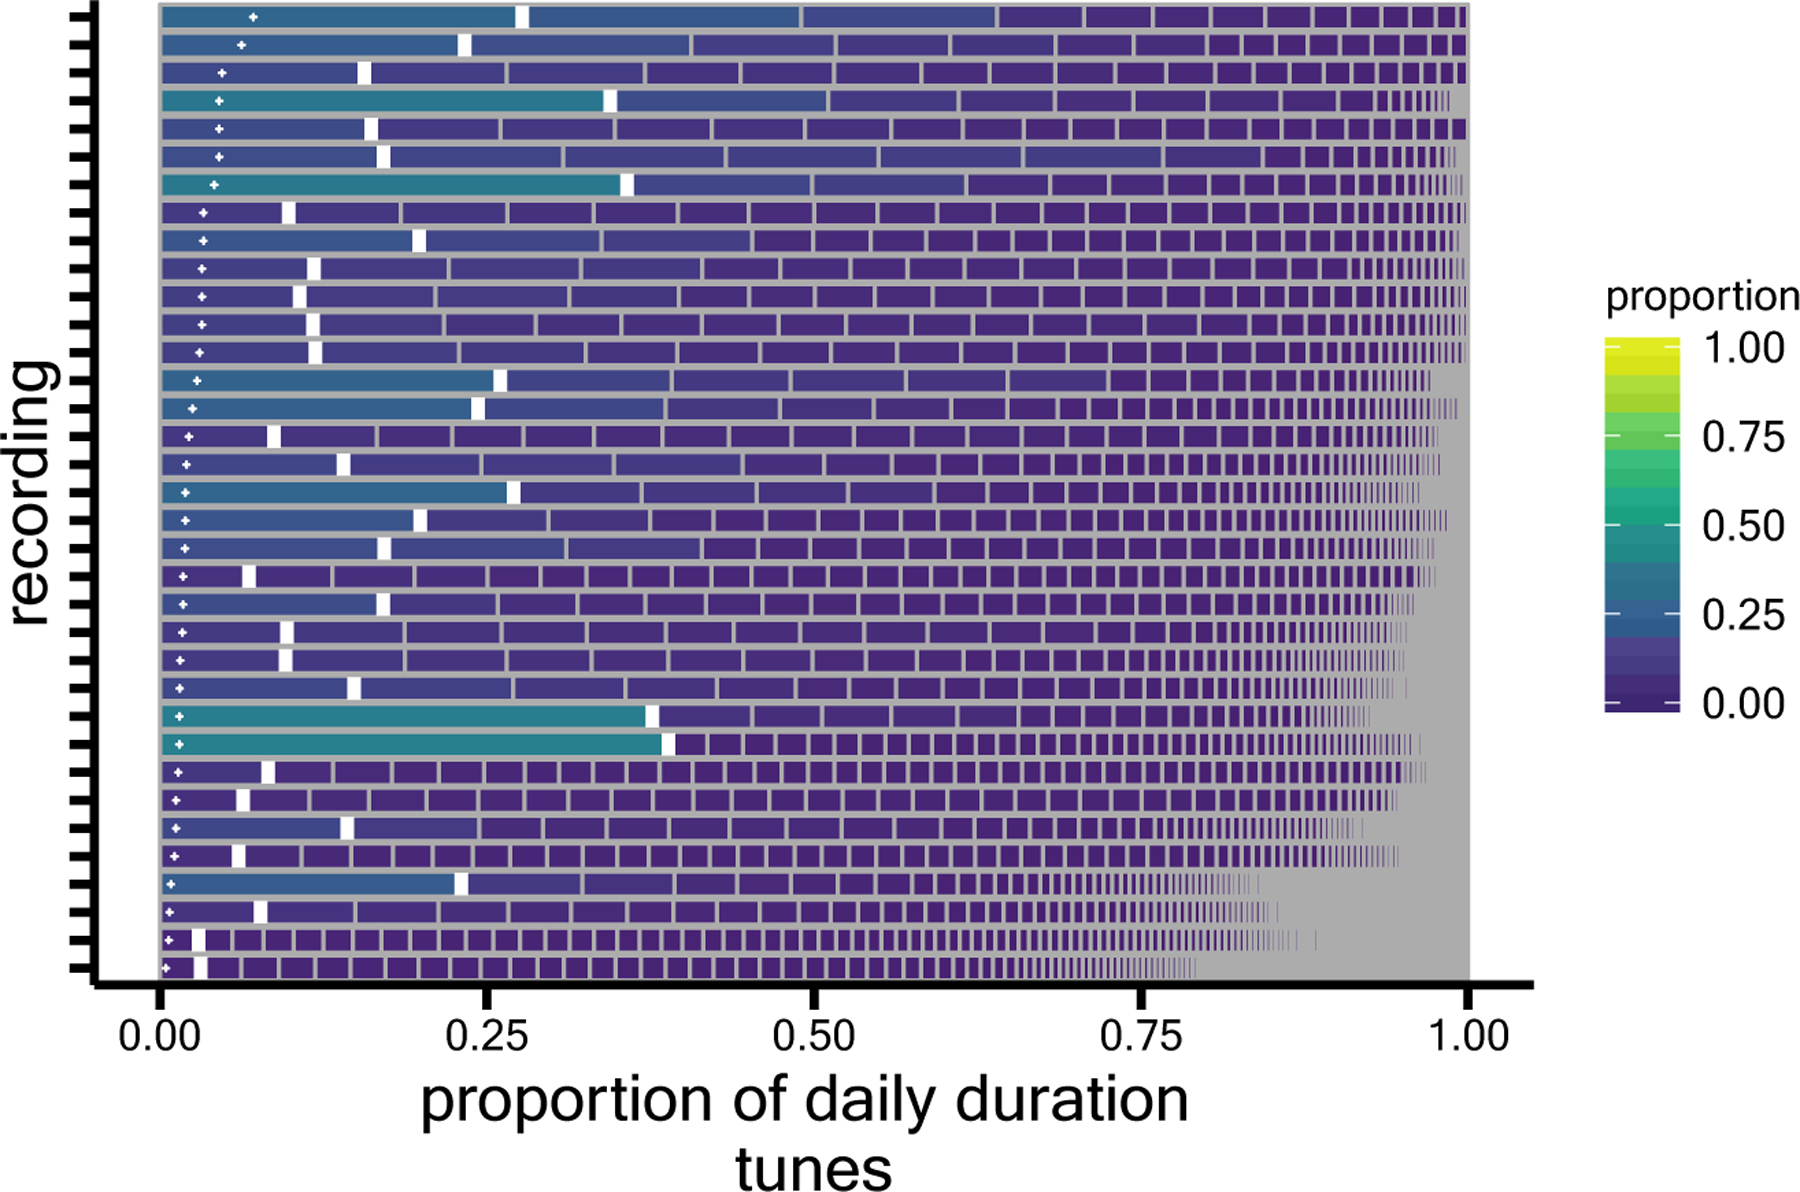
Figure 3.

How much each of a day’s many tunes contributes to the full daily tune distribution for each of 35 infants. Each row corresponds to one day-long audio recording, segmented into unique tune identities (e.g., Twinkle Twinkle Little Star, Itsy Bitsy Spider, Shake It Off, Everybody loves potatoes, Short whistle, and so on). Within the row, each distinct tune’s relative duration (i.e., the proportion of the day’s musical time) is shown, organized from most available to the infant on the left to least available on the right. The observed proportion of each recording’s most available tune is marked by each thick white vertical line. The small white +’s show the proportion that would be expected per tune if each tune were equally available to the infant. Recordings are sorted with those containing the fewest total number of distinct tunes on the top. Figure adapted/reprinted from Mendoza & Fausey (in press).
