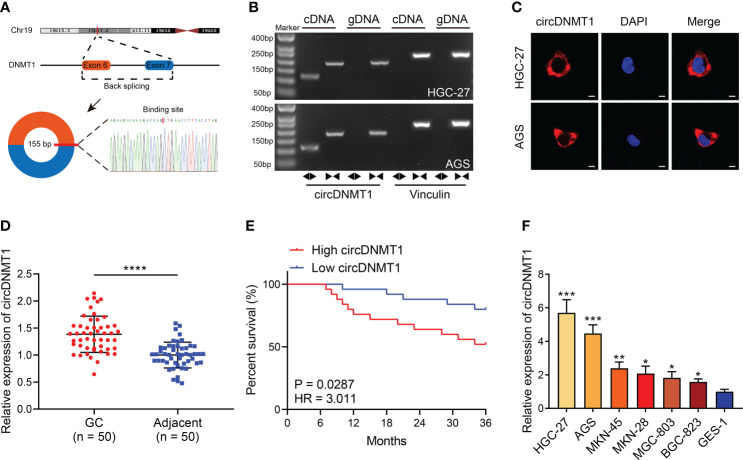
Figure 1.
Identification of circDNMT1 characteristics in GC. (A) The schematic illustration of circDNMT1 origination and the result of Sanger sequencing. (B) The gel electrophoresis to examine amplified product of qRT-PCR using convergent and divergent primers. (C) FISH to display the distributions of cricDNMT1 in HGC-27 and AGS cells. Scale bar: 10 μm. (D) The qRT-PCR analysis to show circDNMT1 expression in 50 pairs of GC and adjacent normal tissues. (E) The Kaplan-Meier plot to show survival time of 50 GC patients who were divided into high-circDNMT1 and low-circDNMT1 groups. (F) The qRT-PCR analysis to show circDNMT1 expression in HGC-27, AGS, MKN-45, MKN-28, MGC-803, BGC-823 and GES-1 cell lines. Data were presented as means ± SD. *P < 0.05, **P < 0.01; ***P < 0.001, ****P < 0.0001.

