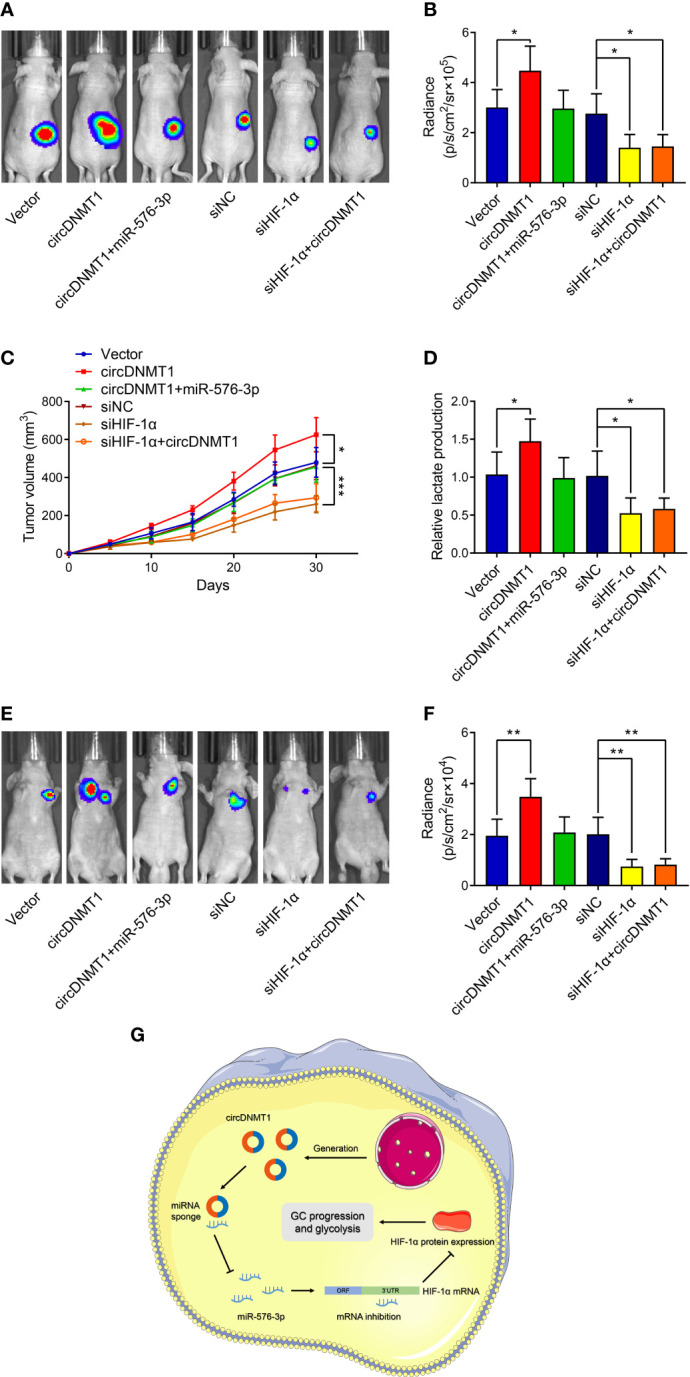
Figure 7.

circDNMT1/miR-576-3p/HIF-1α axis regulated GC growth and metastasis in vivo. (A) Representative bioluminescence images at 30 days after subcutaneous injection of luc-HGC-27 cells. They could be divided into two groups: i) The cells stably carrying lentivirus with vector or HIF-1α overexpression plasmids and transfected with NC or miR-576-3p mimics; ii) The cells transfected with NC shRNA or HIF-1α siRNA and carrying lentivirus with vector or circDNMT1 overexpression plasmids. (B) Luminescence signals in (A) represented by overlaid false-color images with the signal intensity. (C) Curves of tumor volumes as in (A) at the indicated time. (D) Lactate acid production was determined in the tumor tissues from (A). (E) Representative bioluminescence images at 30 days after tail vein injection of luc-HGC-27 cells as in (A). (F) Luminescence signals in (E) represented by overlaid false-color images with the signal intensity. (G) Schematic illustration of the role and mechanisms of circDNMT1 in regulating GC progression. Data were presented as means ± SD. *P < 0.05, **P < 0.01, ***P < 0.001.
