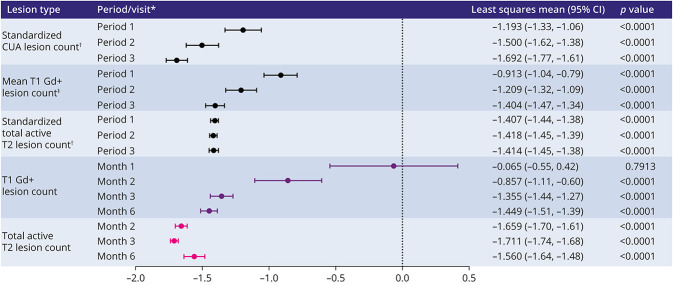
Figure 3. Change in MRI Lesion Counts From the Baseline/Baseline Period.
*Postbaseline periods are compared with the baseline period, and postbaseline visits are compared with the baseline visit. Period 1 (month 1 visit–month 6 visit); period 2 (month 2 visit–month 6 visit); period 3 (month 3 visit–month 6 visit). Models by period: mixed-effects linear model fitted for each period separately. Models by visit: mixed linear model for repeated measures taking within-subject correlation into account. †Parameters are standardized to 1 month. ‡Data are for means within a period. CI = confidence interval; CUA = combined unique active; Gd+ = gadolinium enhancing.

