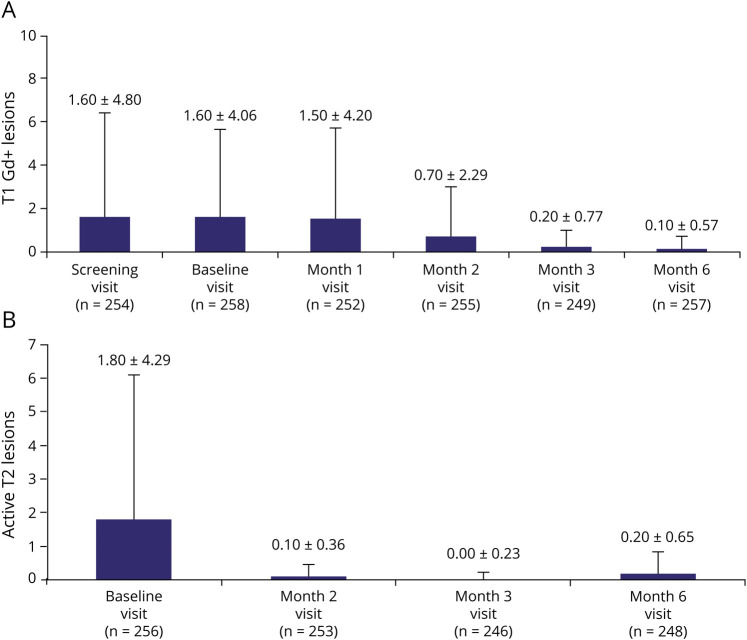
Figure 4. (A) T1 Gd+ Lesion Count and (B) Active T2 Lesion Count* by Visit.
Values indicate the mean +SD for each visit. *Active T2 lesion count (by visit), i.e., the new or enlarging T2 lesions compared with the previous visit. Because of the way in which the data were derived for the active T2 lesions, it was not possible to provide month 1 data. Gd+, gadolinium enhancing.

