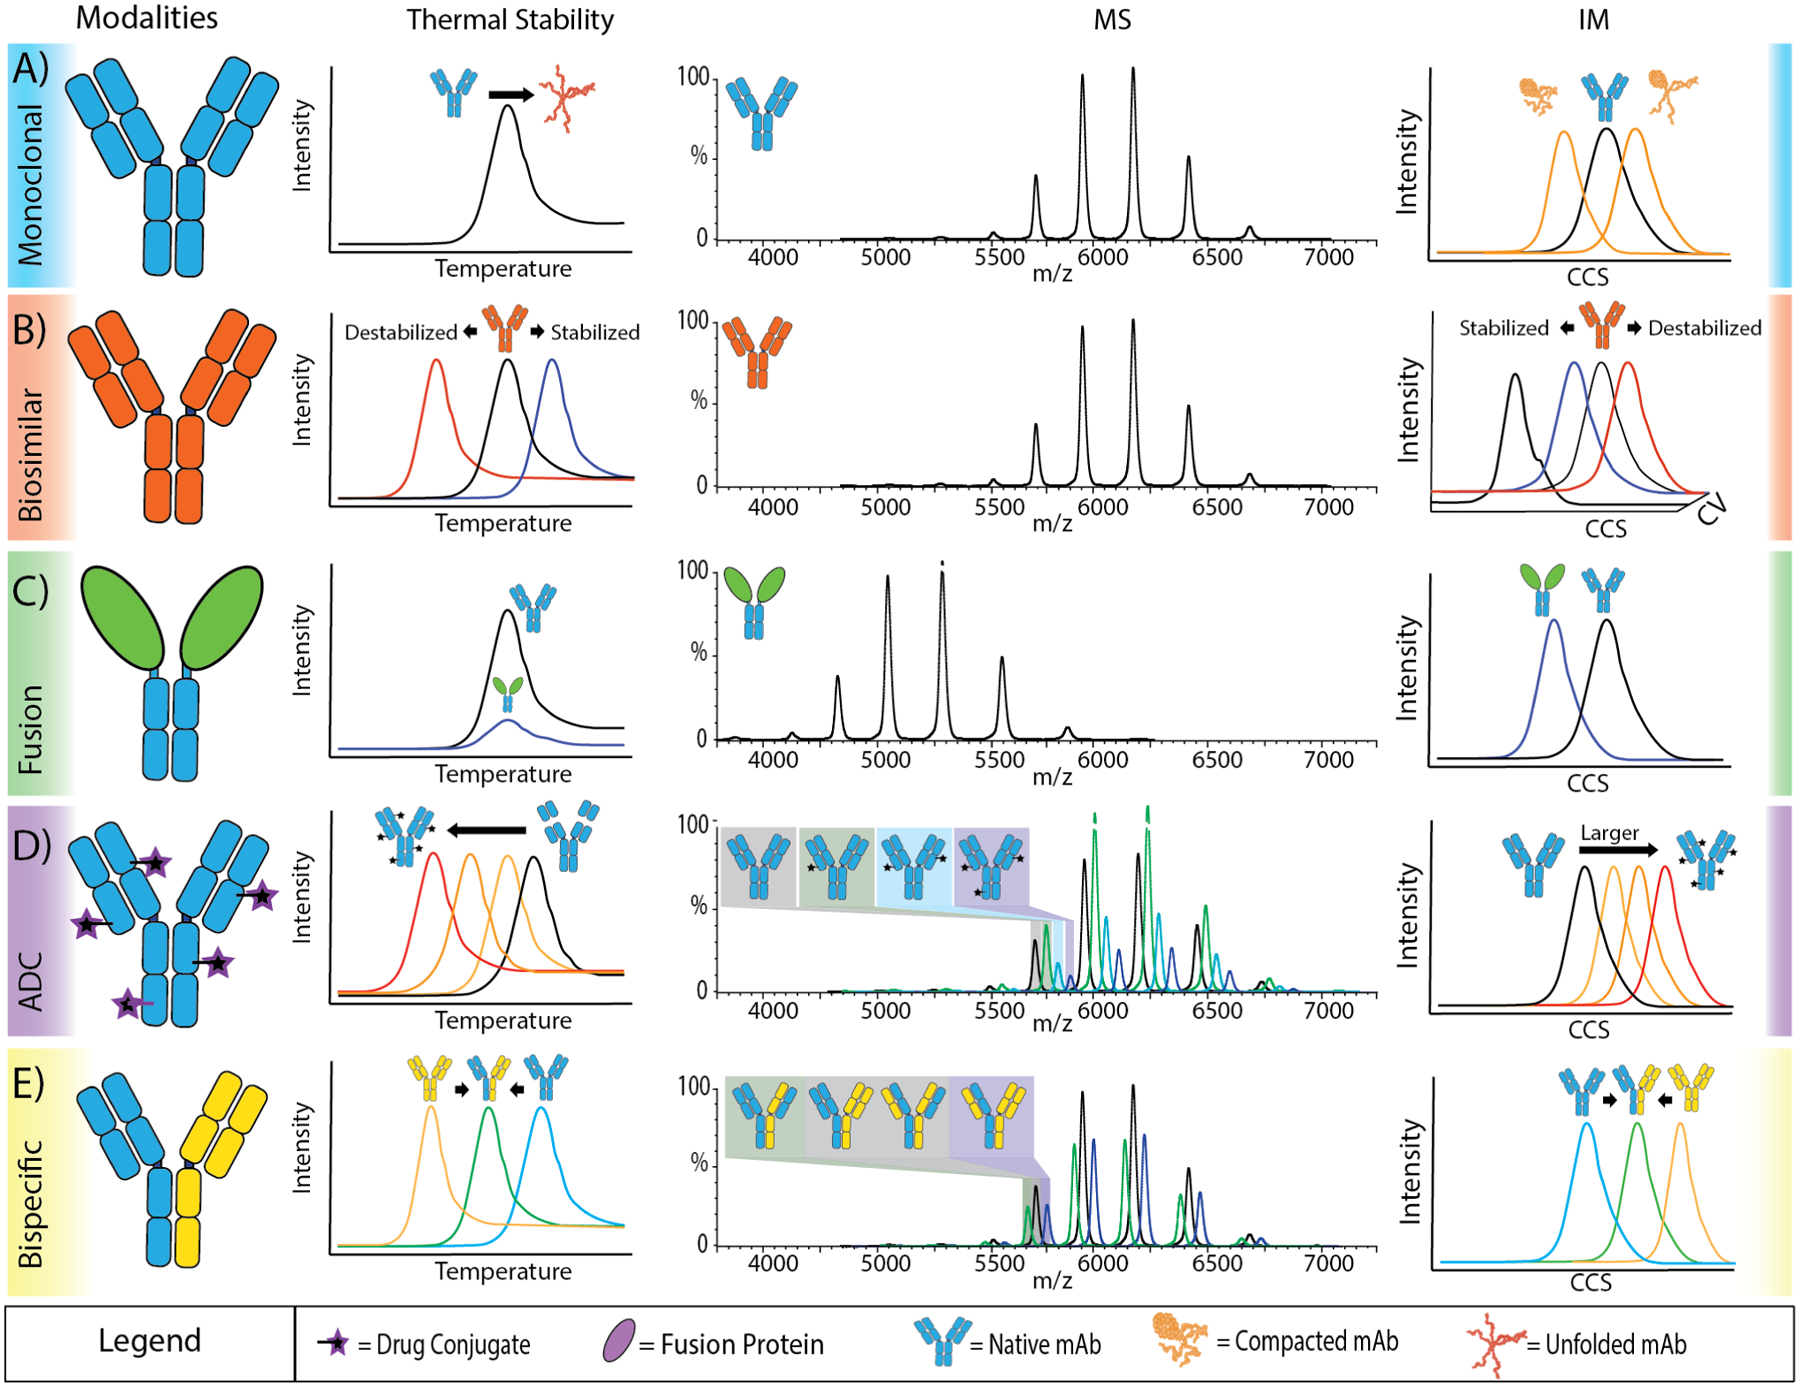
Figure 4.

Data and information content that can be expected from variable temperature, MS and IM datasets for the following biotherapeutic modalities: A) mAbs, B) biosimilars, C) fusion proteins, D) antibody-drug conjugates, and E) bispecific antibodies. Generally, for variable temperature experiments shifts to lower Tm values indicate a decrease in stability and higher values indicate an increase in stability. Changes in mass spectrometry generally indicate different structures or stoichiometries. For IM shifts to lower CCS values indicate more compact structures while larger values indicate larger, often unfolded structures. By applying activation energy and monitoring unfolding, ex. Biosimilar IM, shifts in stability can be monitored by shifts in the IM peak relative to the activation energy.
