Figure 3.
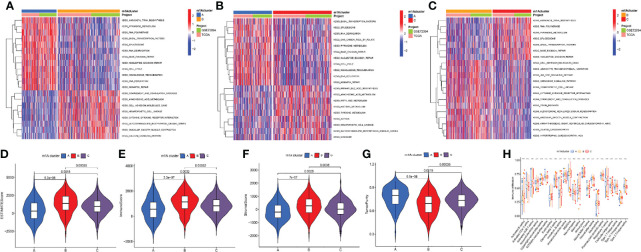
Differences of biological features and immune profiles of three m1A clusters in LUAD. (A–C) GSVA results revealed specific biological pathways of three m1A modification patterns. (A) Cluster A vs. cluster B; (B) cluster A vs. cluster C; (C) cluster B vs. cluster C. (D–G) Violin plots depicted the distribution of ESTIMATE, immune, and stroma scores as well as tumor purity in three m1A modification patterns. (H) Differences in abundance of 23 TME-infiltrating cells under three m1A modification patterns. ** indicates p < 0.01; *** indicates p < 0.001.

